$24,680 - The Profit a Single GPU Generates
The manufacturing cost of one NVIDIA H100 SXM GPU is roughly $3,320. NVIDIA sells it to hyperscalers for approximately $28,000. The difference is $24,680 - a gross margin of 88%.
That is almost unheard-of in the hardware industry. Apple iPhone’s gross margin is around 43%, TSMC’s foundry services sit at roughly 55%, and Samsung Semiconductor comes in at about 35%. At 88%, NVIDIA’s margin structure resembles that of a software company, not a chipmaker.
How is such a margin possible, and what does this structure mean for the broader AI ecosystem? The industry has a name for it: “NVIDIA Tax” - the premium every AI operator ends up paying, directly or indirectly, to NVIDIA.
NVIDIA’s Dominance: The Monopoly in Numbers
Market Share Trajectory
NVIDIA’s revenue-based market share in AI accelerators peaked at 87% in 2024. It has dipped slightly since, as AMD’s MI300 series and custom ASICs gain traction, but the lead remains overwhelming.
| Year | NVIDIA | AMD | Intel + Others | Custom ASIC |
|---|---|---|---|---|
| 2023 | ~92% | ~3% | ~3% | ~2% |
| 2024 | ~87% | ~5% | ~2% | ~6% |
| 2025E | ~80% | ~8% | ~2% | ~10% |
| 2026E | ~75% | ~10% | ~2% | ~13% |
The key point: even as NVIDIA’s share declines, the market itself is expanding so rapidly that absolute revenue keeps rising. NVIDIA’s data center revenue hit $115.2B in FY2025 (Feb 2024-Jan 2025), up 142% year-over-year.
NVIDIA’s Vertical Integration Strategy
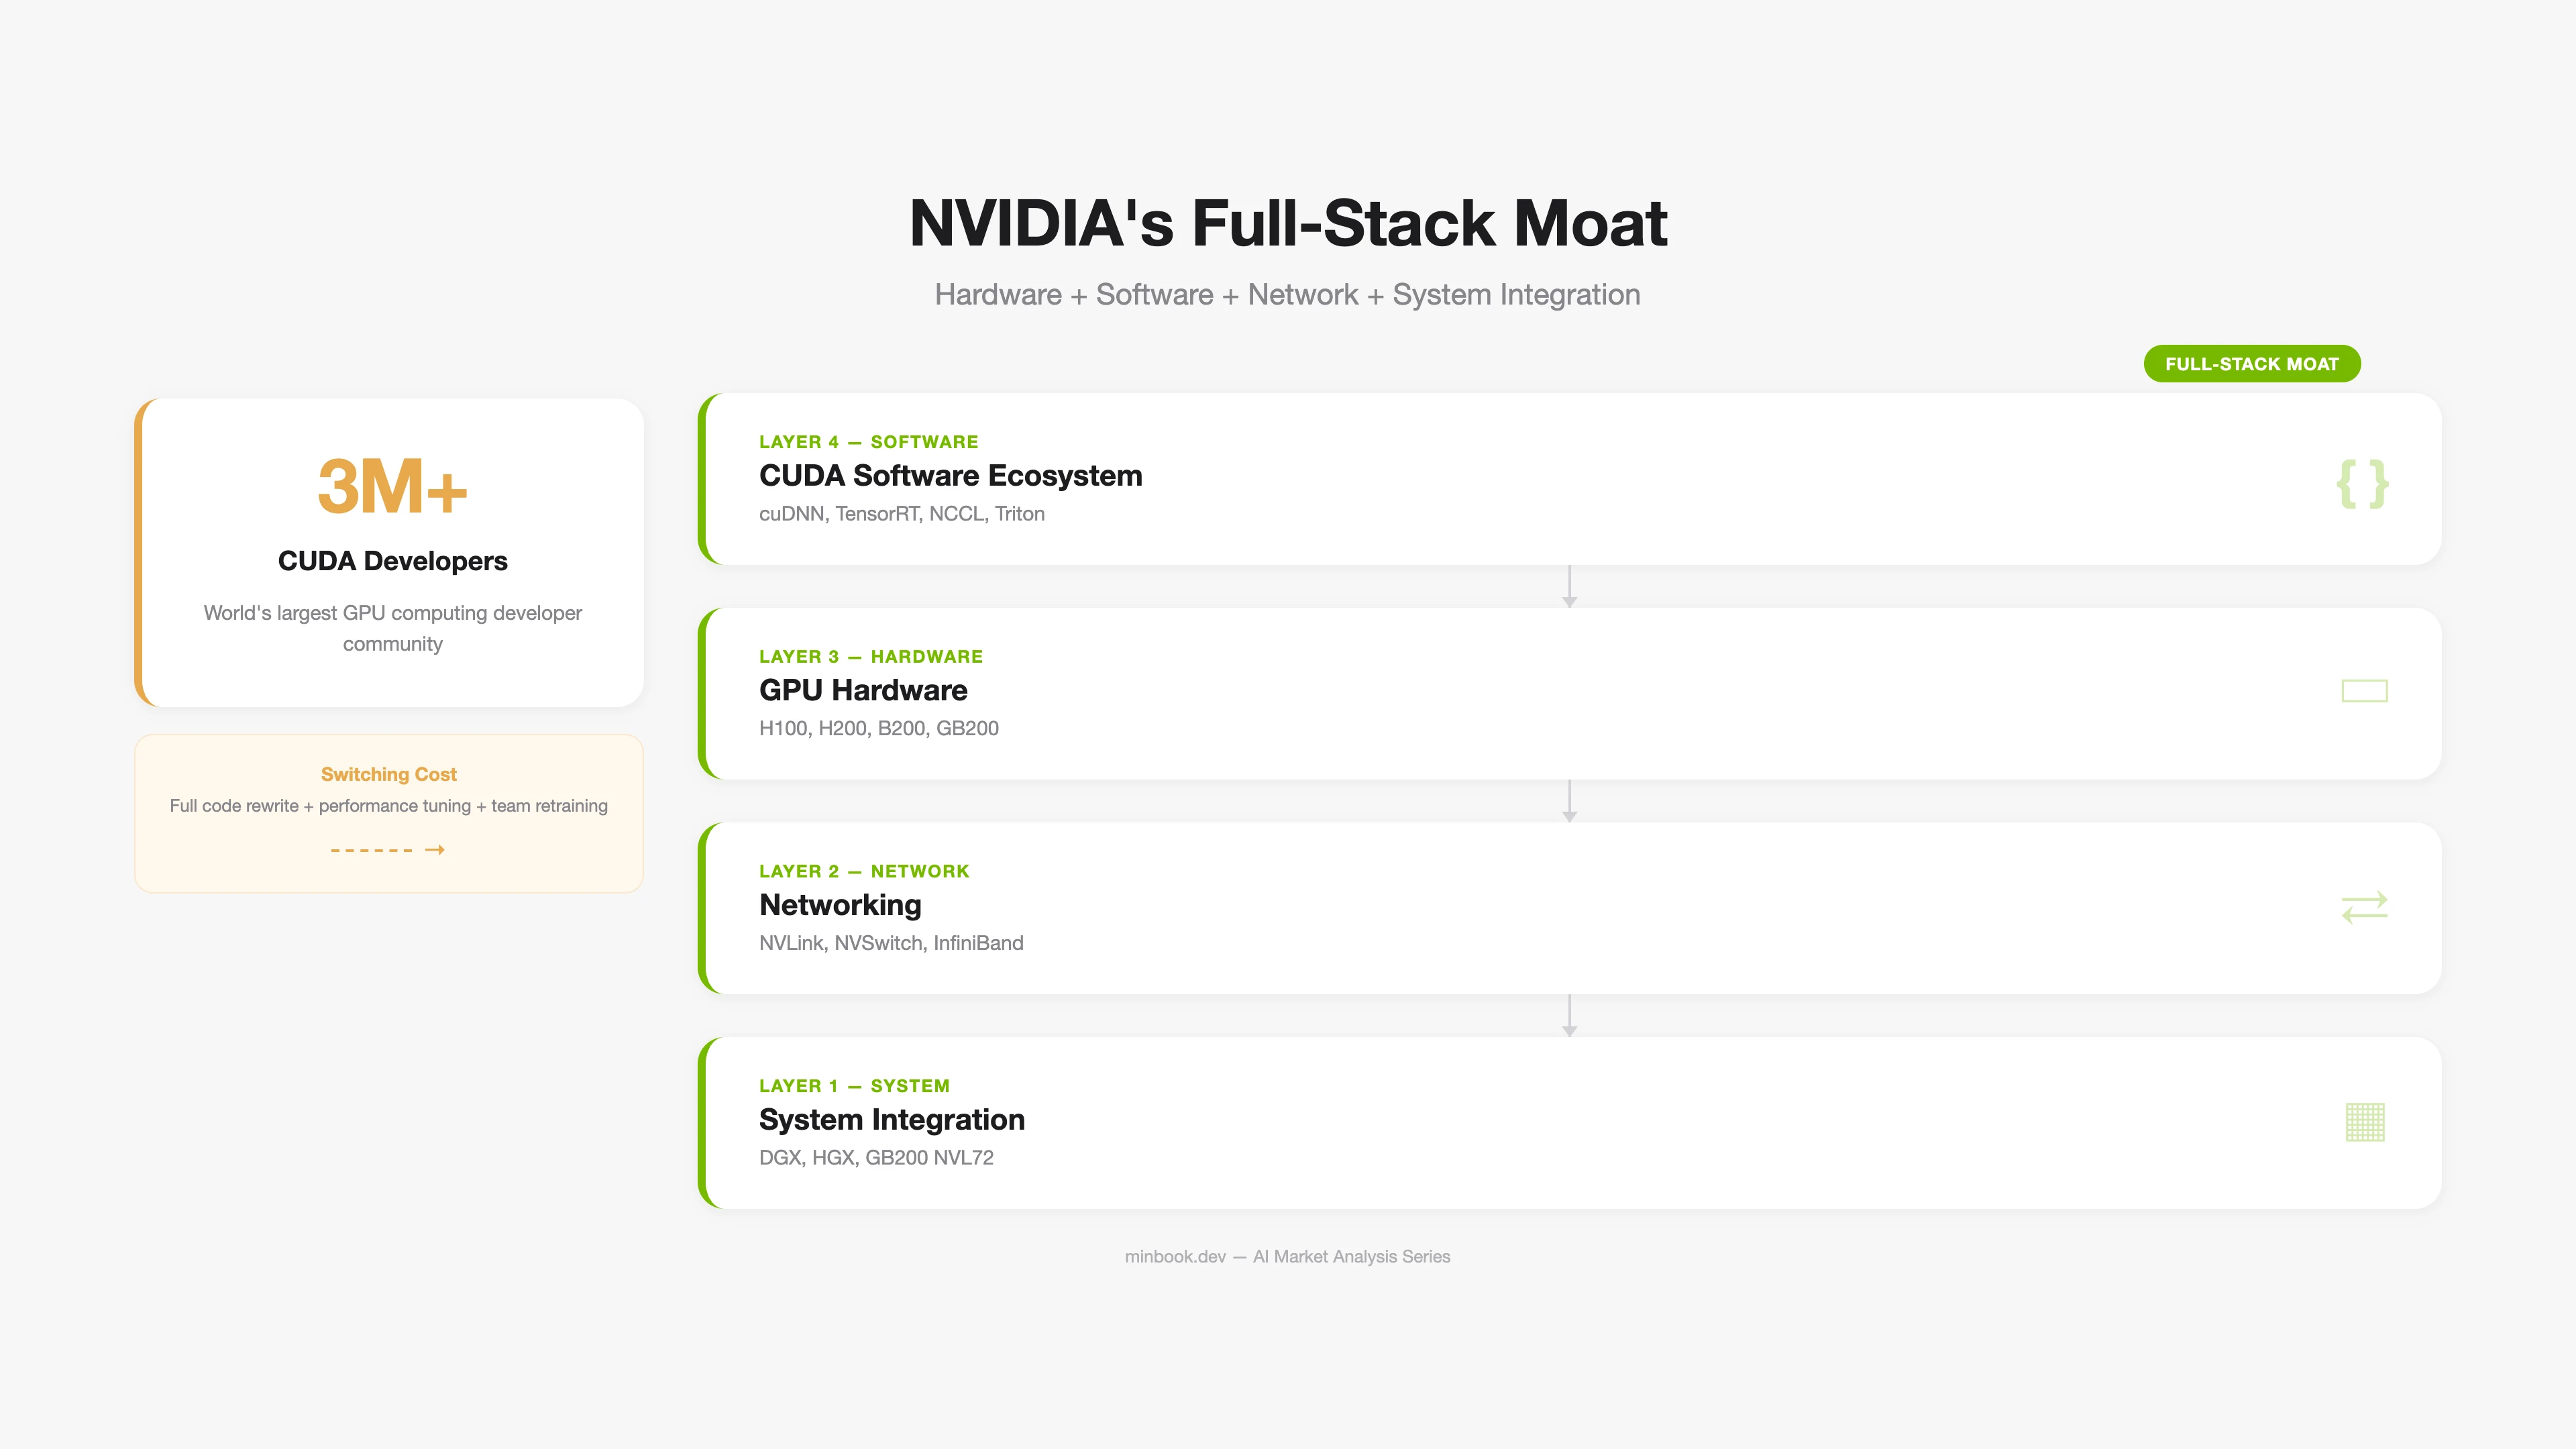
NVIDIA’s monopoly is not simply about “building great GPUs.” The real moat is the CUDA ecosystem - a software-level lock-in.
The Reality of CUDA Lock-in:
-
Developer ecosystem. An estimated 90%+ of AI/ML developers worldwide use CUDA. Every major framework - PyTorch, TensorFlow, JAX - defaults to CUDA as its backend.
-
Optimization libraries. Hundreds of specialized libraries - cuDNN (deep learning), TensorRT (inference optimization), NCCL (multi-GPU communication) - are tuned for NVIDIA GPUs. AMD’s ROCm and Intel’s oneAPI exist, but gaps in performance and stability remain.
-
Switching cost. Migrating CUDA-based AI workloads to another platform requires code rewrites, performance tuning, and extensive testing. For large-scale model training, this transition can take months.
The Structure of “NVIDIA Tax”
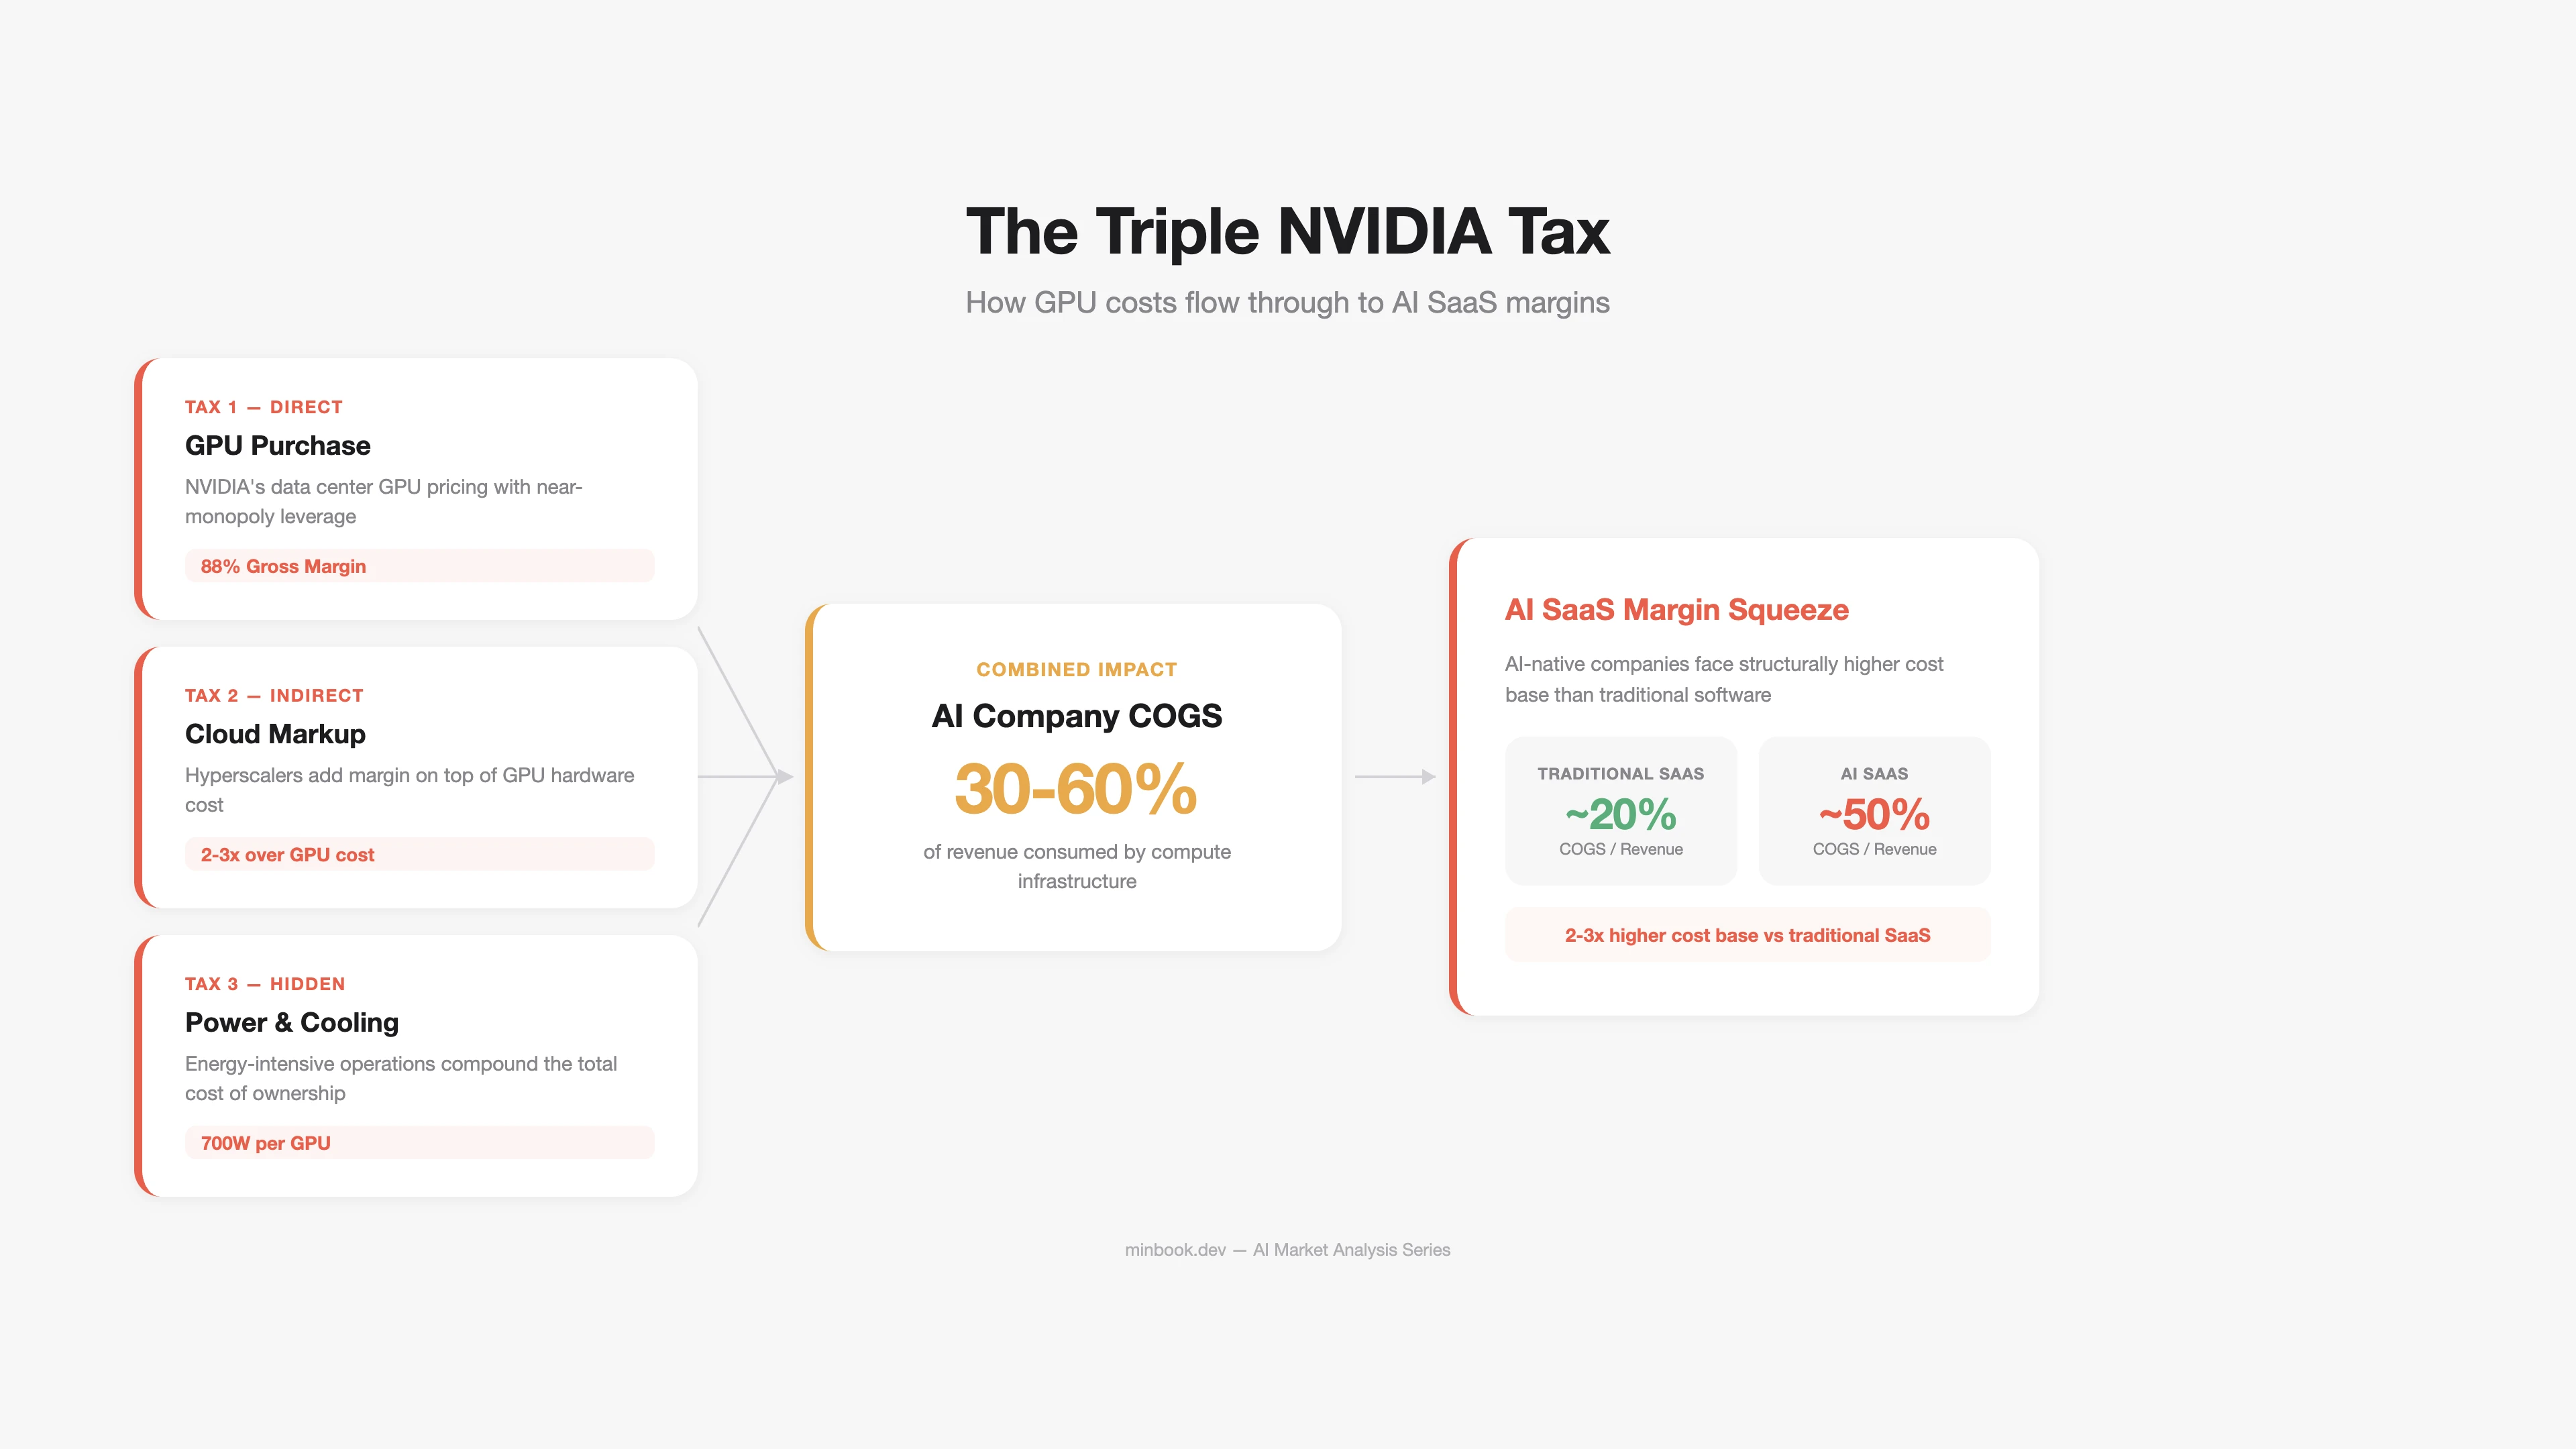
“NVIDIA Tax” is the premium that every company running AI pays - directly or indirectly - to NVIDIA. This tax is levied through multiple channels.
Direct Tax: GPU Purchases
This is the cost hyperscalers pay NVIDIA outright. The Top 5 hyperscalers’ CapEx forecast for 2026 ranges from $602B to $690B, with a significant share going toward NVIDIA GPU procurement.
| GPU Model | Launch | Price (per unit) | Key Specs |
|---|---|---|---|
| H100 SXM | 2023 | ~$28,000 | 80GB HBM3, training standard |
| H200 | 2024 | ~$35,000 | 141GB HBM3e, inference-optimized |
| B200 | 2025 | ~$40,000 | Next-gen Blackwell |
| GB200 NVL72 | 2025 | ~$2.3M (72-GPU rack) | Ultra-scale training/inference |
Indirect Tax: Cloud GPU Markup
AWS, Azure, and GCP purchase NVIDIA GPUs and resell them as cloud services, adding a 2-3x markup.
| Item | Cost |
|---|---|
| NVIDIA’s H100 price to hyperscalers | ~$28,000 |
| Hyperscaler H100 cloud instance, 3-year cumulative revenue | ~$80,000-$120,000 |
| Annual GPU cost actually paid by AI startups | 30-60% of revenue |
The result: GPU/inference costs account for 30-60% of COGS in AI SaaS companies. Compare that to traditional SaaS, where COGS typically runs 15-25% - that is 2-3x higher. This is the structural force compressing AI SaaS margins.
Hidden Tax: Power and Cooling
Power consumption from NVIDIA GPUs is another component of the “tax.” A single H100 has a TDP (Thermal Design Power) of 700W. A GB200 NVL72 rack draws 120kW. The share of total data center power costs attributable to GPUs is growing rapidly.
Three Scenarios That Could Break the Monopoly
Whether NVIDIA’s dominant position will endure is debated from multiple angles. Here are three structural shifts that could alter the landscape.
Scenario 1: The Rise of Custom ASICs
Google (TPU), Amazon (Trainium/Inferentia), Microsoft (Maia), and Meta (MTIA) are all developing their own AI chips. These chips are optimized for specific workloads - primarily inference - and can deliver 2-5x better cost efficiency compared to NVIDIA GPUs.
| Chip | Developer | Primary Use | Advantage over NVIDIA |
|---|---|---|---|
| TPU v6 (Trillium) | Gemini training/inference | Claims 50% TCO reduction | |
| Trainium2 | Amazon | Bedrock inference | 30-50% cost reduction |
| Maia 100 | Microsoft | Azure AI inference | Optimized for own infra |
| MTIA v2 | Meta | Llama inference/ranking | Inference-specialized efficiency |
Limitation: Custom ASICs are concentrated on inference workloads rather than training. For general-purpose training workloads, replacing the flexibility of NVIDIA GPUs and the CUDA ecosystem remains difficult. Moreover, each hyperscaler’s custom chip is available only on its own cloud, so this dynamic is closer to internal CapEx reduction than a market-wide competitive shift.
Scenario 2: AMD Closing the Gap
AMD’s MI300X/MI325X leads NVIDIA in HBM capacity, and its ROCm software stack is improving. AMD’s AI accelerator revenue for 2025 is estimated at ~$8B, with market share growing to ~8%.
Key variable: ROCm maturity. Compared to CUDA, ROCm still trails in library compatibility, debugging tools, and community support. However, as PyTorch’s ROCm support stabilizes, switching costs are gradually declining.
Scenario 3: Inference Efficiency Reduces GPU Demand
This is the most intriguing scenario. Advances in model compression, quantization, mixed precision, and MoE (Mixture of Experts) architectures are reducing the number of GPUs needed for the same workload.
DeepSeek-V3 claims to have cut training costs by over 90% through its MoE architecture. If such efficiency gains become widespread, they could affect not NVIDIA’s absolute revenue but its growth rate.
“A 280x drop in inference costs over 24 months means that the GPUs needed for a given task have shrunk to 1/280th. Usage has grown far faster, of course, so absolute demand has increased - but if this efficiency trend continues, there may come a point where it catches up with demand growth.”
Implications for AI Companies
Audit Your Cost Structure
If you are running AI products or services, you need a clear picture of how much GPU/inference costs consume as a share of revenue.
| GPU Cost Share | Status | Response |
|---|---|---|
| Over 60% of revenue | Critical | Prioritize model compression, caching, batch optimization |
| 30-60% of revenue | Caution | Leverage multi-cloud, spot instances |
| Under 30% of revenue | Healthy | Invest margin headroom into product differentiation |
Multi-Vendor Strategy
Reducing single-vendor dependency on NVIDIA is a long-term risk management imperative. Specifically:
- Separate inference from training. Use NVIDIA GPUs for training; distribute inference across custom ASICs or AMD.
- Introduce abstraction layers. Use inference optimization frameworks like vLLM and TensorRT-LLM to lower hardware switching costs.
- Compare cloud GPU pricing. Even for the same GPU, prices vary 20-40% across AWS, Azure, GCP, CoreWeave, and Lambda Labs.
Sources
- H100 cost/margin analysis - Jarvislabs, Cyfuture Cloud
- NVIDIA market share - Silicon Analysts, Carbon Credits (2025.01)
- NVIDIA FY2025 earnings - NVIDIA 10-K Filing (SEC), Data Center Revenue $115.2B
- CUDA ecosystem - NVIDIA Developer Program, CUDA-X Libraries (3M+ devs)
- Hyperscaler CapEx - IEEE Communications Society (2025.12), CNBC (2026.02), Futurum Group (2026.02)
- Google TPU v6 - Google Cloud Blog “Introducing Trillium”, Trillium GA
- Amazon Trainium2 - AWS re:Invent 2024 Recap, Amazon Q4 2025 Earnings Transcript
- AMD AI accelerators - AMD Q4 2025 Earnings, Motley Fool (2026.01)
- LLM inference cost decline - Stanford AI Index 2025, a16z “LLMflation”
- DeepSeek-V3 efficiency - DeepSeek Technical Report (arXiv), Epoch AI Analysis
Related Posts
Anatomy of the AI Market in 3 Layers - What the $660B Really Looks Like
First installment of a series analyzing the AI market across three layers: infrastructure ($500B+), platform ($18B+), and applications ($80B+)

Where AI Value Accrues: Benedict Evans and Jensen Huang's Two Maps
Evans and Jensen both treat the model as a commodity, then split on whether value flows up to apps or down to infrastructure

2027 AI Market Scenarios - Where Does the $660B Go?
Three-scenario analysis (Bull/Base/Bear) of the AI market's $660B CapEx and survival strategies by segment