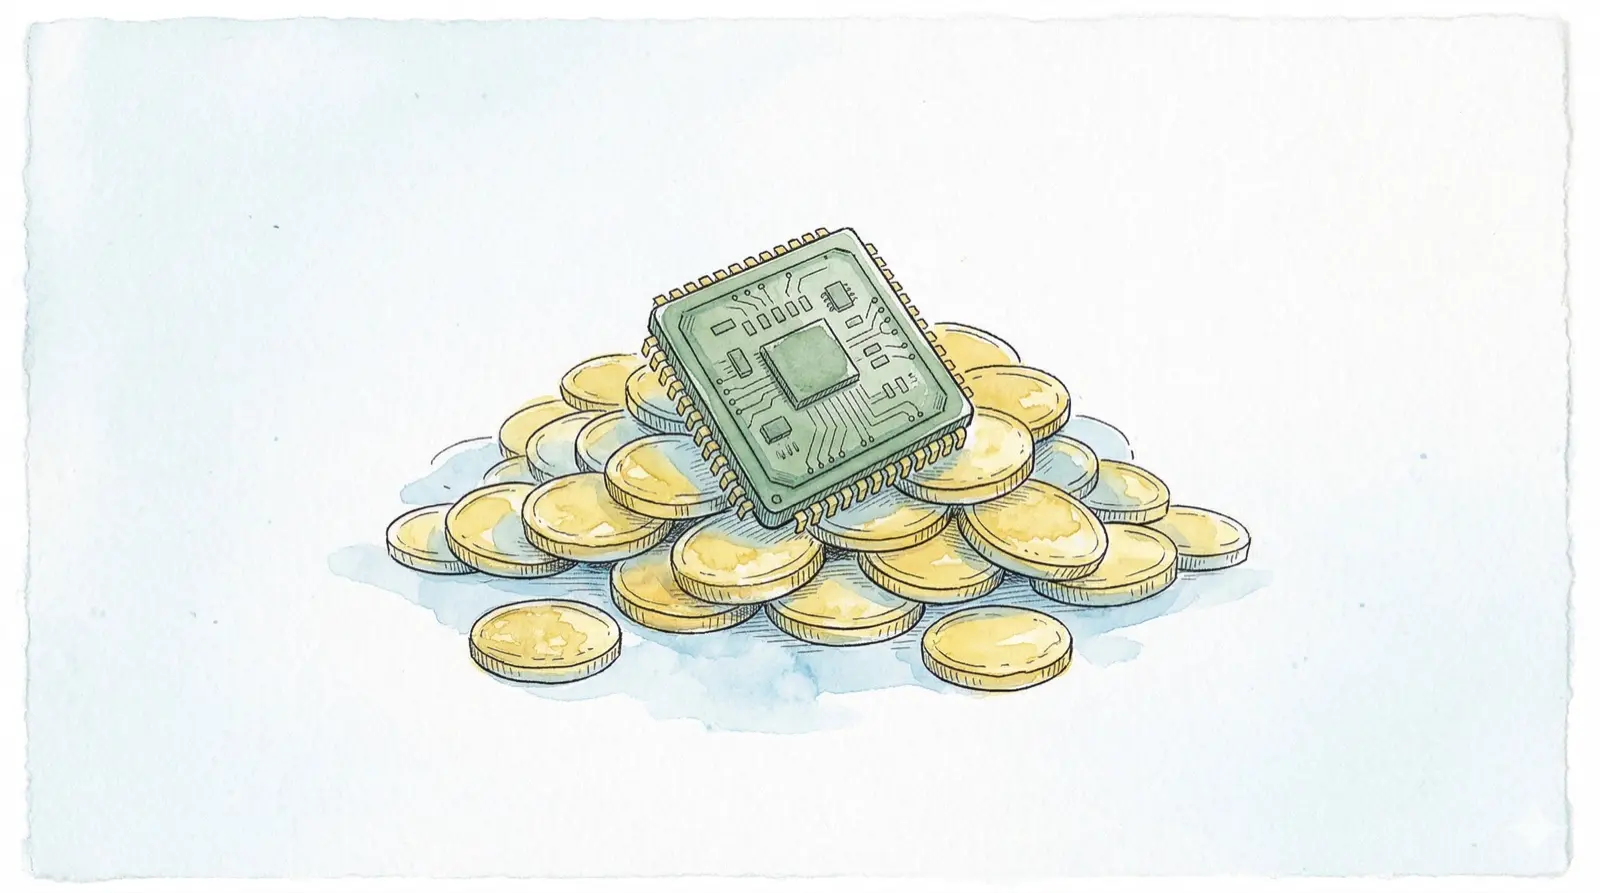
The $660B Question
The Top 5 hyperscalers’ 2026 CapEx outlook stands at $660B–$690B. This money is already being deployed. GPUs have been ordered, data centers are under construction, and power contracts have been signed. There is no turning back.
The question that remains open is the path to return on this investment. As we explored in Part 1, the ratio between infrastructure investment ($660B) and application revenue ($80B) currently sits at roughly 8:1. Whether this gap closes quickly or repeats the dot-com era pattern is the central question.
In this post, we analyze the AI market through 2027 across three scenarios and present the impact by segment and survival strategies for each.
Scenario Design Framework
Two key variables determine the scenarios:
- Speed of enterprise AI demand realization — 72% of CIOs have yet to see AI ROI (Gartner 2025). How quickly does this ratio improve?
- Inference cost decline vs. usage growth — Inference costs have fallen 280x over 24 months. How fast does usage growth offset continued cost declines?

Bull Scenario: AI Delivers on Its Promises (Probability 25%)
Prerequisites
- AI agents reach a level of genuinely autonomous task execution (Level 3+ Autonomy)
- Enterprise AI adoption rises above 60% by 2027
- AI-generated code/content approaches human-level quality
- Inference costs drop another 100x, unlocking new use cases
Market Size Projections
| Segment | 2026E | 2027E (Bull) | Growth Drivers |
|---|---|---|---|
| Infrastructure | $500B+ | $700B+ | Sustained excess demand, further CapEx expansion |
| Platform | $18B+ | $45B+ | Explosion in agent API demand |
| Application | $80B+ | $200B+ | Mass enterprise adoption |
What Happens in the Bull Case
Infrastructure: NVIDIA’s dominance weakens slightly (75% to 70%), but absolute revenue grows to $150B+. HBM demand exceeds supply by 2x. Custom ASICs capture 30%+ of the inference market.
Platform: AI agent frameworks (LangChain, CrewAI, etc.) become enterprise standards. The model API market consolidates into a three-way race among OpenAI/Anthropic/Google. Inference cost declines cause usage-based revenue to plateau, but companies pivot to agent orchestration billing models.
Apps: AI SaaS GRR improves to 60%+. Deeper workflow integration raises switching costs. The distinction between “AI-native” and “AI-enhanced” companies becomes meaningless as all software embeds AI.
Historical analogy for the Bull scenario: The cloud transition of the 2010s. Early resistance — “security concerns,” “on-prem is cheaper” — gave way to AWS generating $90B+ annually. AI could follow a similar trajectory.
Base Scenario: Selective Success, Broad Correction (Probability 50%)
Prerequisites
- AI delivers clear ROI in specific domains (coding, customer service, data analytics)
- But general-purpose AI agents fall short of expectations
- CapEx growth rate decelerates starting 2027 (dropping to 10–15% annual increases)
- Some AI SaaS companies fail at scale, triggering restructuring
Market Size Projections
| Segment | 2026E | 2027E (Base) | Growth Drivers |
|---|---|---|---|
| Infrastructure | $500B+ | $550B+ | Slowing CapEx growth, inference efficiency gains |
| Platform | $18B+ | $30B+ | Specialized demand in coding and customer service |
| Application | $80B+ | $130B+ | Selective enterprise adoption |
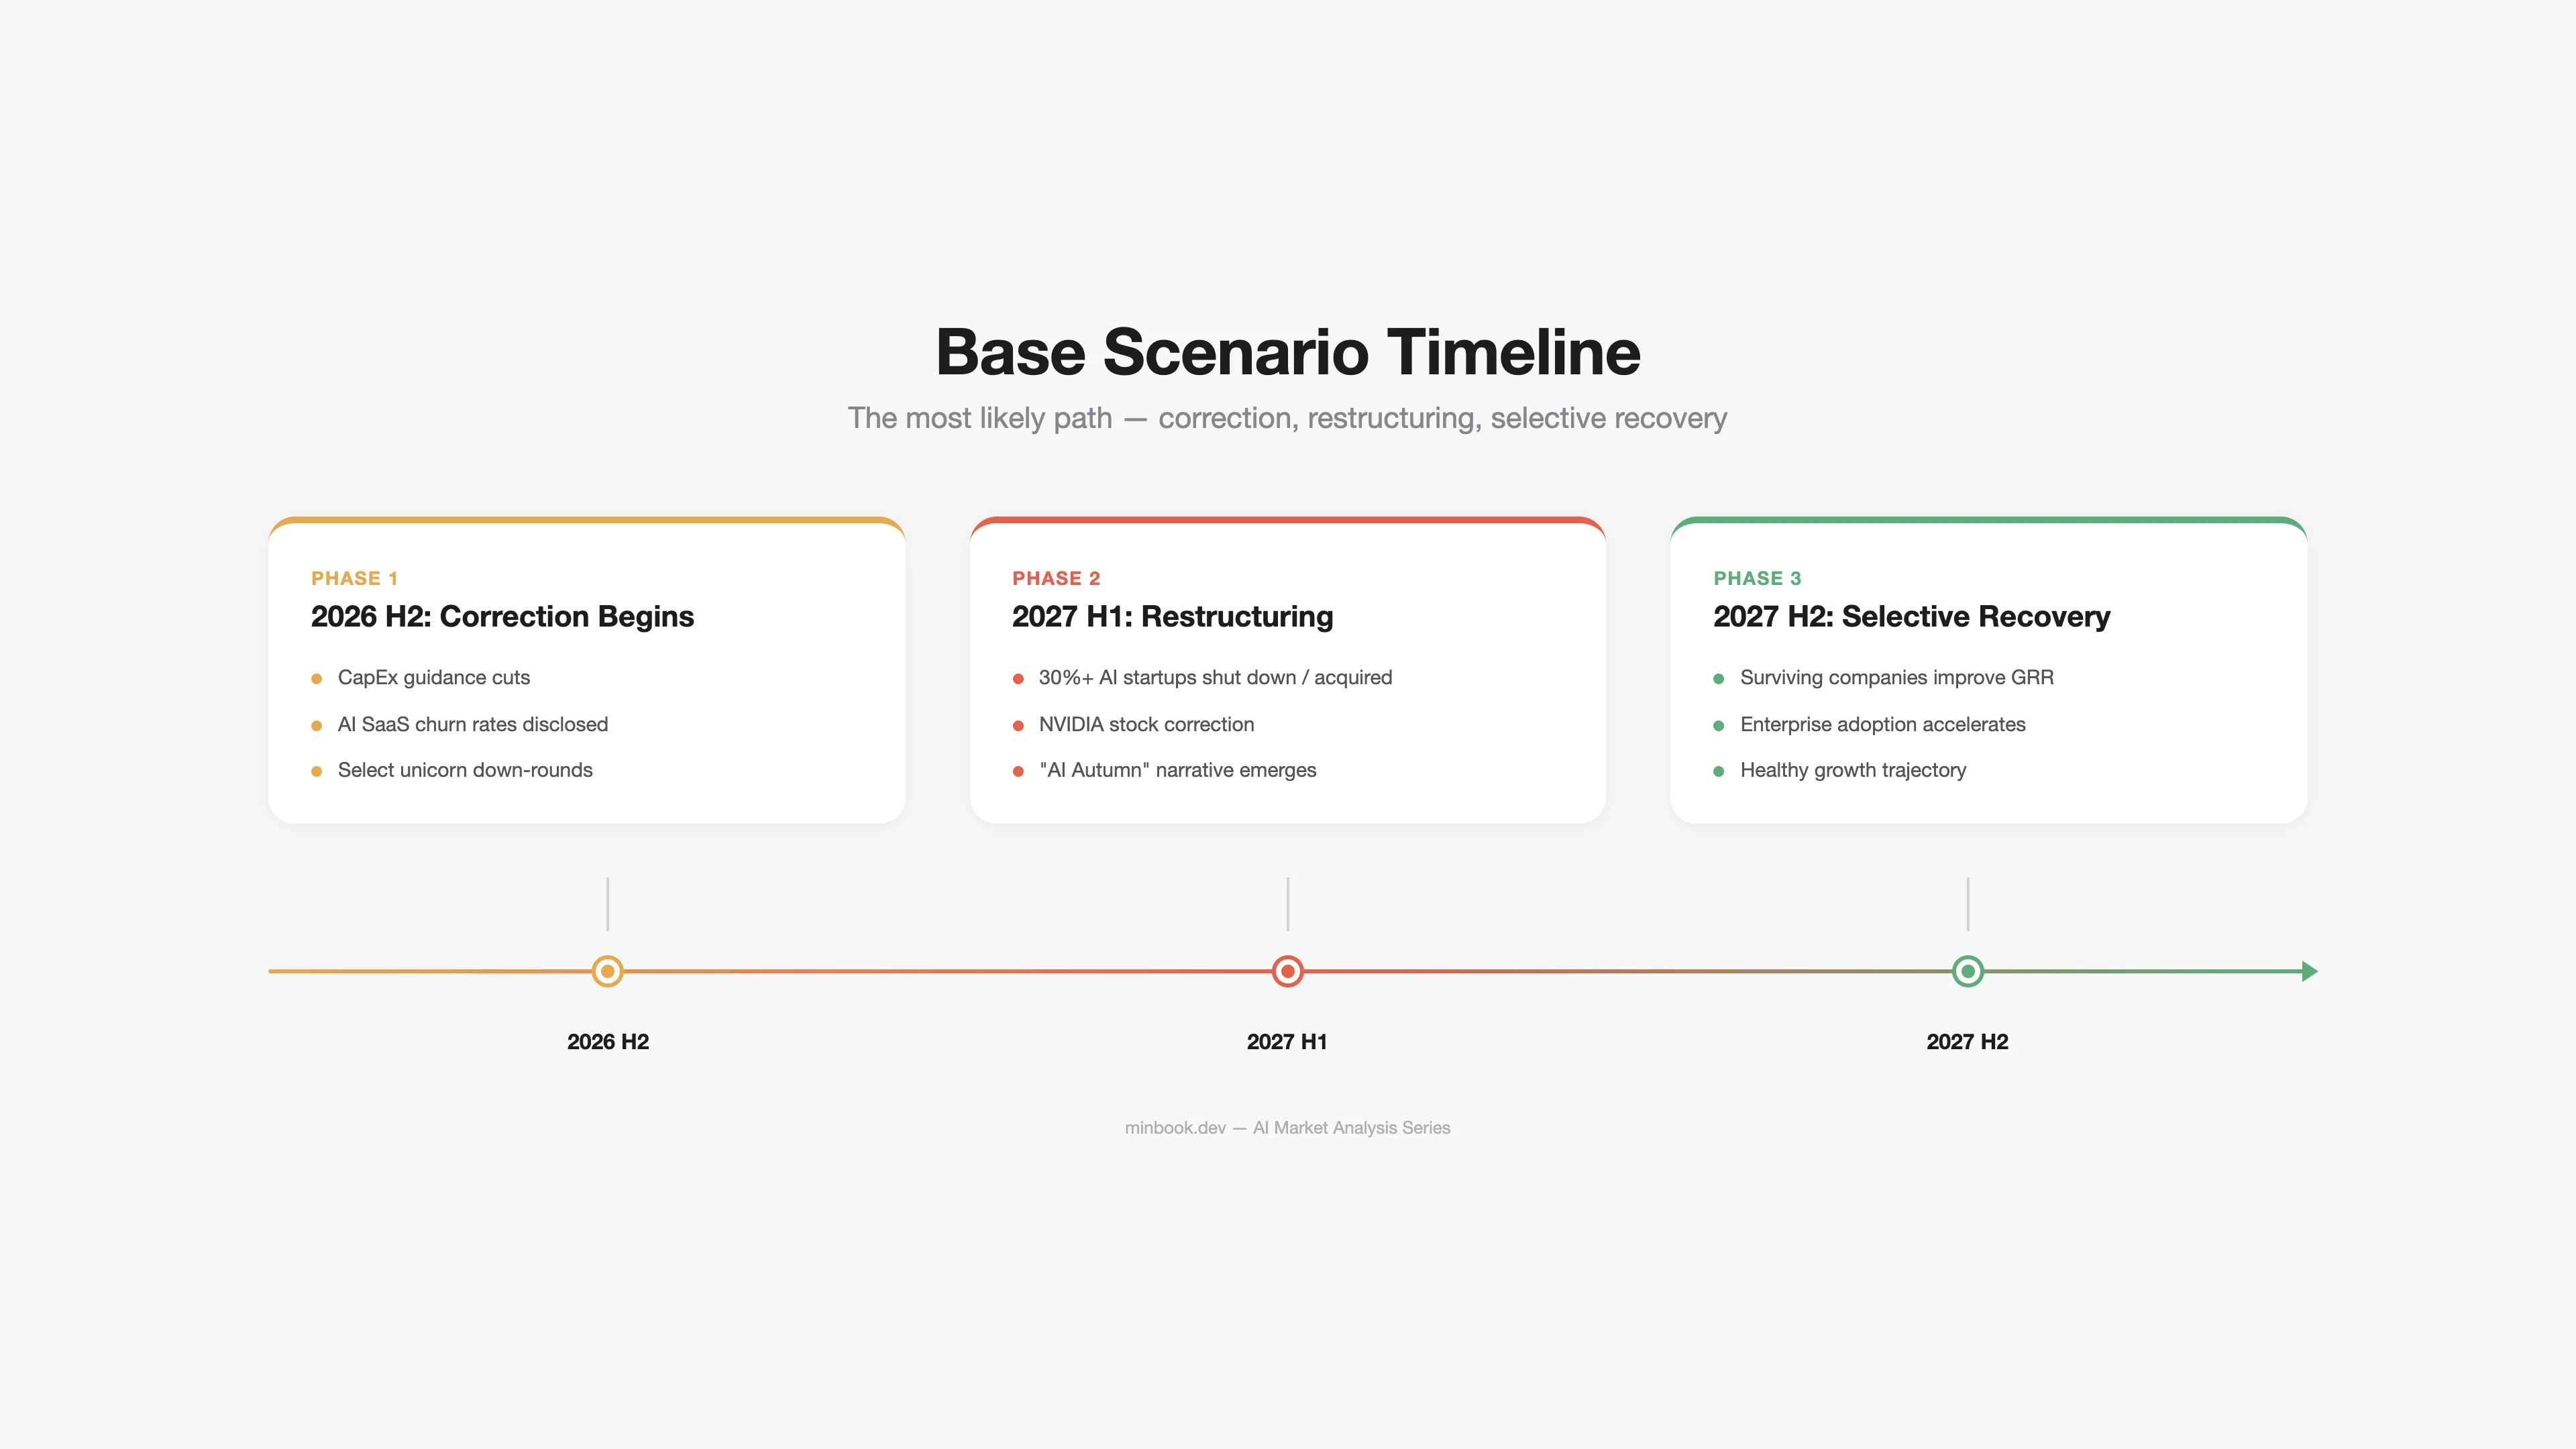
What Happens in the Base Case
Infrastructure: Hyperscalers revise 2027 CapEx guidance downward. “We planned to spend $700B but are pulling back to $600B.” This announcement alone could send NVIDIA’s stock down 20–30%. Yet absolute investment remains historically massive, and GPU demand continues.
Platform: ARR growth at OpenAI and Anthropic decelerates — from 3–4x annual growth to 1.5–2x. Some AI startups (Jasper, Writesonic types) get acquired or shut down. The survivors are domain-specialized + workflow-integrated companies.
Apps: Sweeping restructuring across AI SaaS. As VC funding becomes selective, AI wrapper companies with low GRR fail en masse. The term “AI winter” resurfaces, but the reality is closer to an “AI autumn” — overheated expectations adjusting to realistic levels.
Historical analogy for the Base scenario: The 2001–2003 dot-com correction. Amazon’s stock dropped 90% but survived to become a $1T+ company. Pets.com vanished. AI could undergo the same selection process.
Bear Scenario: The AI Bubble Bursts (Probability 25%)
Prerequisites
- Enterprise AI ROI shows no improvement by 2027 (70%+ of companies still below breakeven)
- Performance improvements in large AI models plateau (scaling laws hit their limits)
- Geopolitical risks materialize (tighter US-China AI chip export controls, TSMC risk)
- Surging energy costs drive up data center operating expenses
Market Size Projections
| Segment | 2026E | 2027E (Bear) | Growth Drivers |
|---|---|---|---|
| Infrastructure | $500B+ | $350B | Drastic CapEx cuts, GPU surplus |
| Platform | $18B+ | $15B | Intensifying price wars, company failures |
| Application | $80B+ | $60B | Mass churn, “AI winter” |
What Happens in the Bear Case
Infrastructure: GPU oversupply hits. Hyperscalers cancel or defer orders, causing NVIDIA’s revenue to decline quarter-over-quarter for the first time. Secondhand H100/H200 prices drop by 50% or more. Cloud GPU prices fall in tandem, which paradoxically makes AI usage significantly cheaper.
Platform: Massive cost cuts begin at major model companies — OpenAI, Anthropic, and others. With OpenAI’s annual inference costs at $10B+ and revenue growth slowing, cash burn becomes critical. Instead of an IPO, strategic acquisition (e.g., Microsoft’s full acquisition of OpenAI) emerges as a realistic scenario.
Apps: 60%+ of AI SaaS companies shut down. VC funding dries up in the AI sector, mirroring the 2022 crypto winter pattern. However, domain-specialized AI companies that have proven ROI (legal AI, coding AI, etc.) get acquired at undervalued prices and see their value recognized.
The Bear Paradox: Rebuild After Destruction
Even in the Bear scenario, AI technology itself does not disappear. The internet kept growing after the dot-com bubble burst in 2000. In fact, Amazon, Google, and Facebook were built on top of the infrastructure that excess investment had laid down.
The biggest beneficiaries in the Bear scenario are:
- Startups leveraging cheap compute from the GPU surplus
- Companies hiring AI talent shed by large corporations
- Cash-rich companies that showed restraint during the overheated period (Apple, Berkshire, etc.)
Cross-Scenario Impact by Segment
| Segment | Bull (25%) | Base (50%) | Bear (25%) |
|---|---|---|---|
| Infrastructure | Sustained excess demand | Slowing CapEx growth | GPU oversupply |
| Platform | Agent API explosion | Selective growth | Price wars + restructuring |
| Apps | GRR 60%+, mass adoption | AI wrapper restructuring | 60%+ company shutdowns |
| NVIDIA | $150B+ revenue | Decelerating growth | First-ever revenue decline |
| OpenAI | $50B+ ARR | $35B ARR, slower growth | Strategic acquisition target |
| Korea (Infra) | HBM demand surge | HBM demand sustained | HBM price decline |
| Korea (Apps) | Niche AI export opportunities | Domestic-focused growth | Government subsidy dependence |
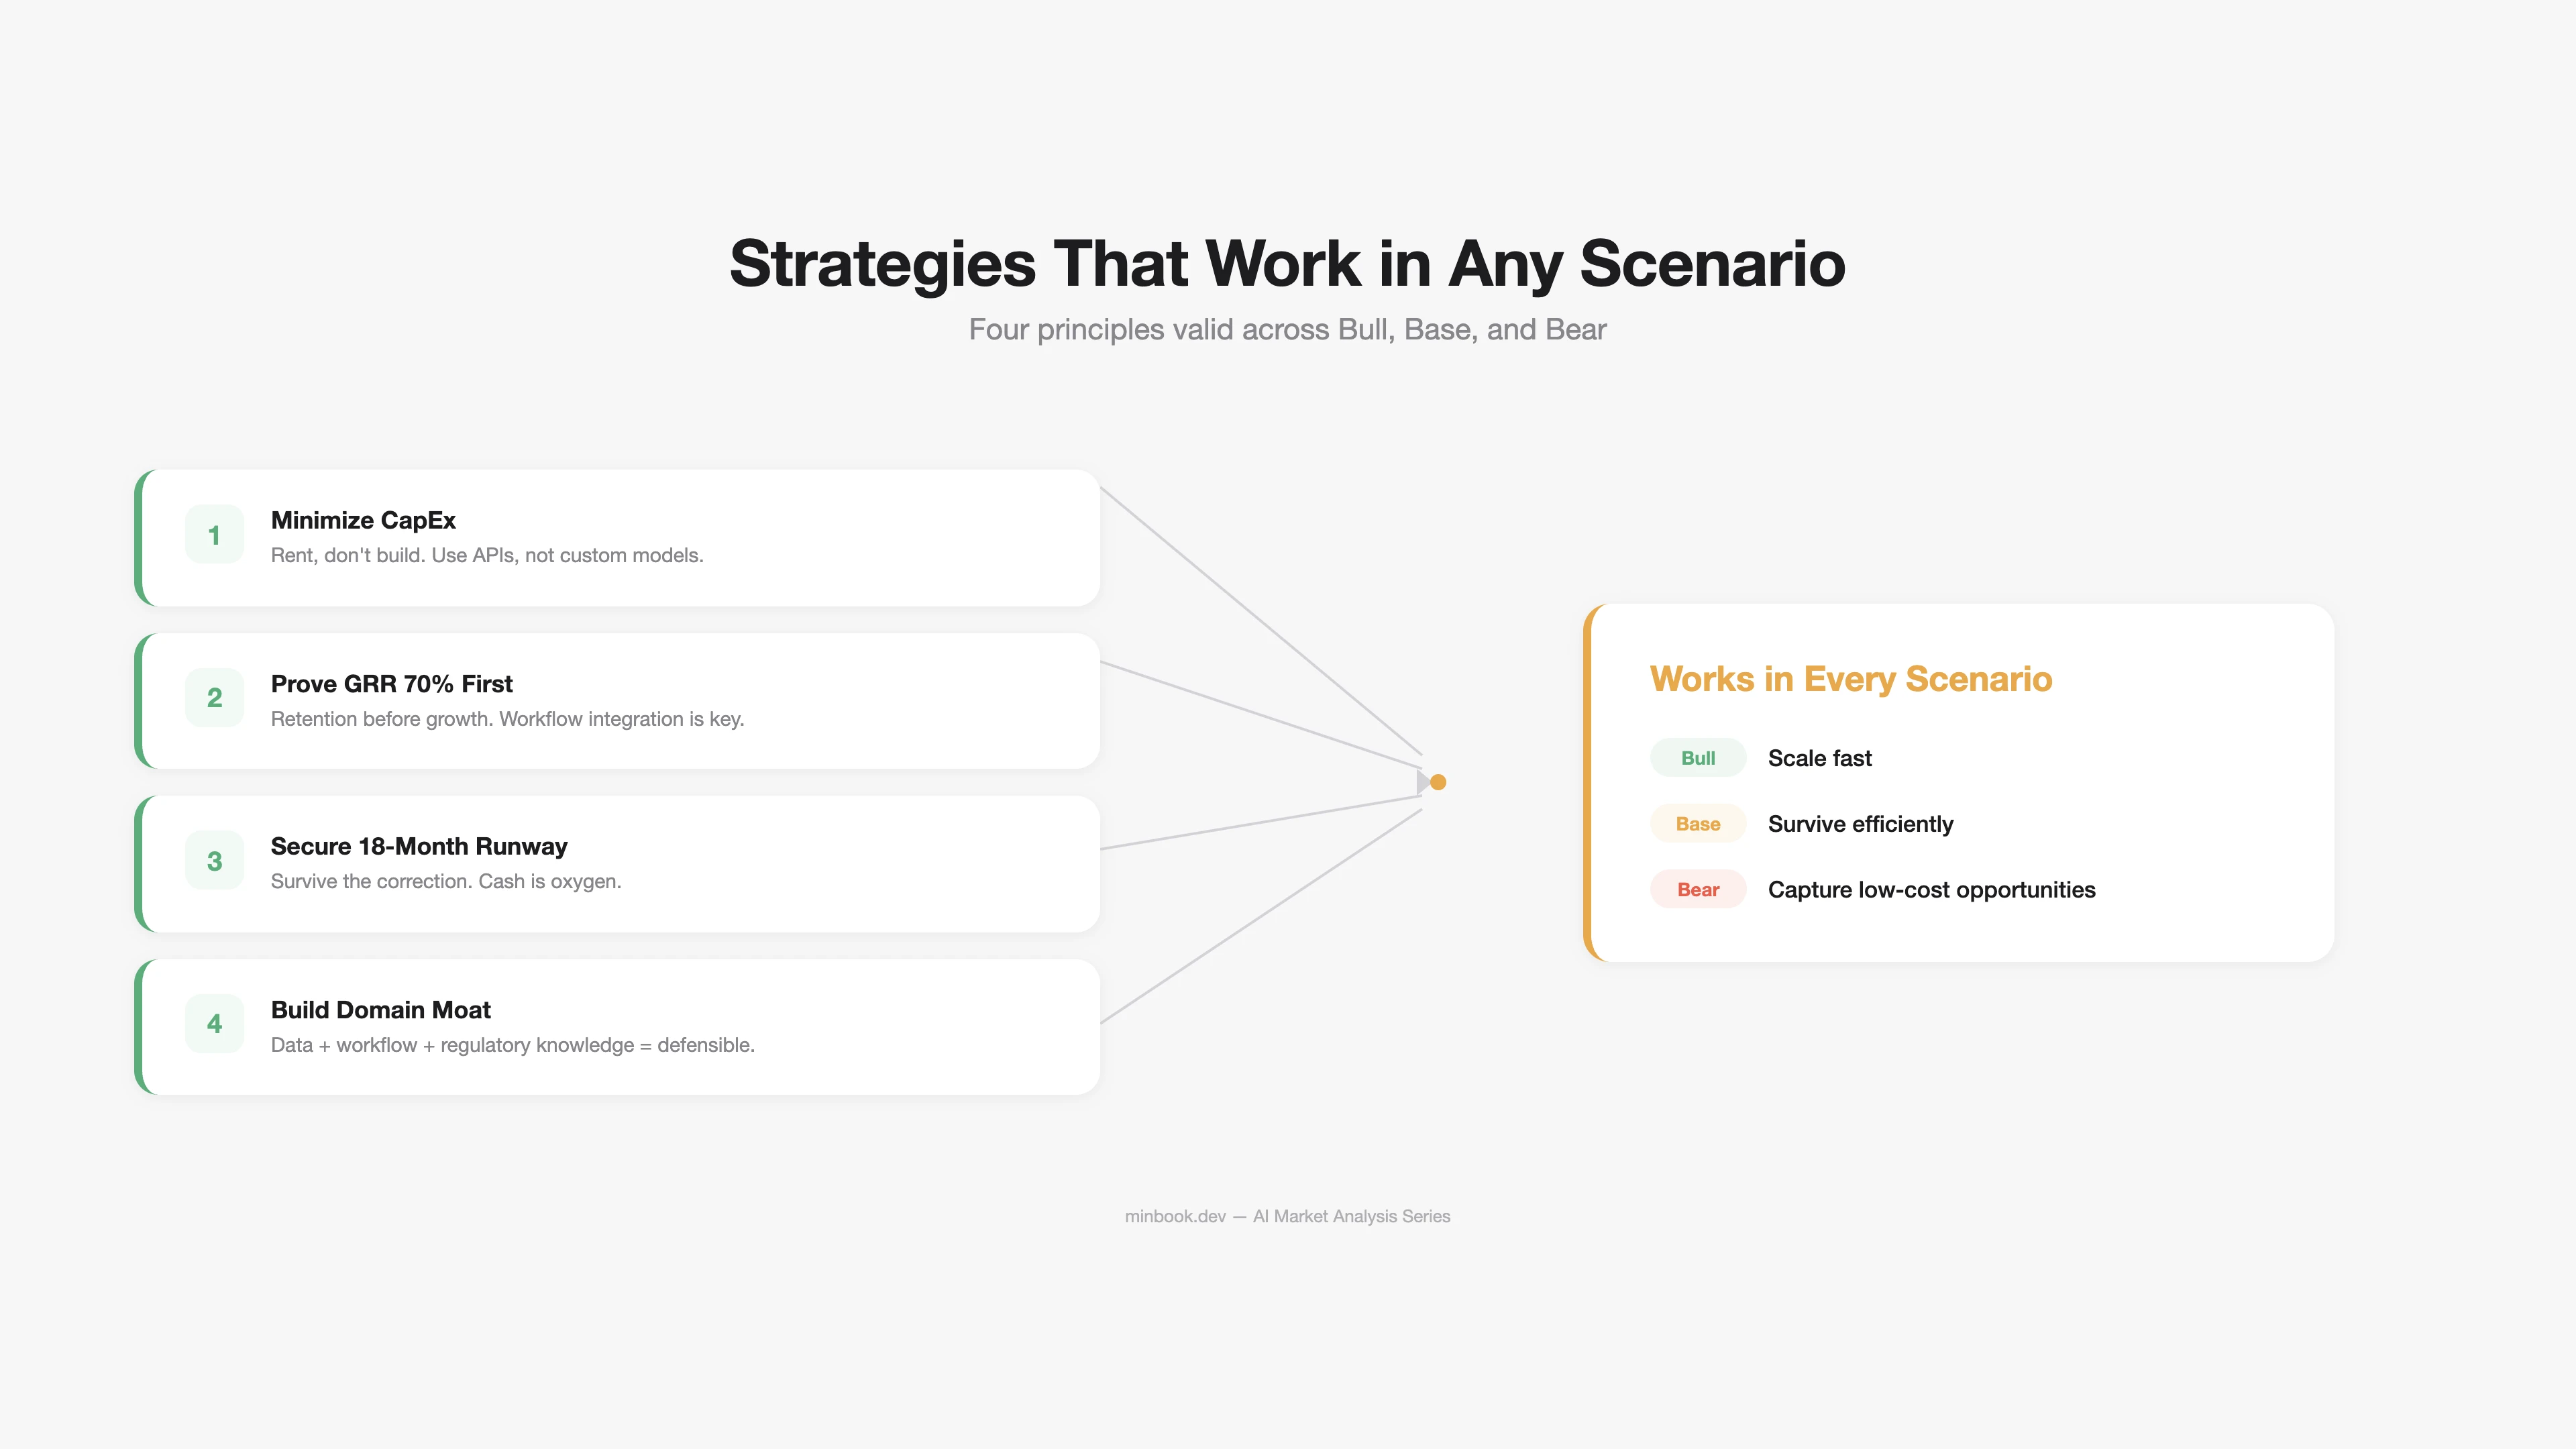
Strategies That Hold Across All Scenarios
Regardless of which scenario materializes, the following strategies remain valid.
1. “Don’t Invest in AI Infrastructure — Build on Top of It”
Avoid bearing CapEx risk. Rent GPUs instead of buying them, use APIs instead of building models, leverage the cloud instead of constructing data centers. If the Bear scenario arrives, infrastructure costs plummet — and companies that avoided CapEx benefit the most.
2. “Prove GRR 70% First”
The critical KPI for AI products is not ARR growth rate but GRR. As analyzed in Part 3, achieving GRR 70%+ requires:
- Deep workflow integration
- Proprietary data/models
- Value-based pricing at $250+/month
You need at least one of these three.
3. “Maintain 18 Months of Runway”
In the Base/Bear scenarios, VC funding may become selective or dry up entirely. Managing burn rate and securing at least 18 months of runway is the baseline condition for survival.
| Runway | Status | Response |
|---|---|---|
| Under 6 months | Crisis | Immediate cost cuts, bridge funding |
| 6–12 months | Caution | Moderate growth pace, prioritize profitability |
| 12–18 months | Managed | Selective investment + efficiency gains |
| 18+ months | Stable | Position to capture scenario-specific opportunities |
4. “Dig a Domain Moat”
General-purpose AI becomes a red ocean of price competition. The defensible moat lies in the combination of data + workflow + regulatory expertise within specific domains (legal, healthcare, manufacturing, finance). This holds true in every scenario.
Closing: Understanding the Economics of Each Segment
Throughout this series, we examined the AI market not as a single number but segment by segment. Under the same label of “AI market,” an infrastructure segment with 88% margins coexists alongside an application segment with 40% GRR. The landscape looks entirely different depending on which segment you occupy and what role you play.
What is certain is that the $660B in investment is already being deployed. What is uncertain is the path to returns. Whichever scenario plays out, the strategy of “keeping CapEx light, proving retention first, and digging moats in your domain” appears sound.
Sources
- Hyperscaler CapEx Outlook — IEEE Communications Society (2025.12), CNBC (2026.02), Futurum Group (2026.02), Goldman Sachs (2025.09)
- CIO AI ROI Survey — Gartner Newsroom (2025.05 survey, n=506)
- LLM Inference Cost Trends — Stanford AI Index 2025, a16z “LLMflation”, Epoch AI
- AI SaaS GRR/NRR — ChartMogul “The AI Churn Wave” (2025.09)
- OpenAI/Anthropic ARR — PYMNTS, SaaStr, Yahoo Finance (2026.02–03)
- NVIDIA Financials — NVIDIA FY2025 10-K (SEC), Q4 Earnings Call Transcript
- Dot-com Bubble Comparison — Scott Galloway “Prof G”, Morgan Stanley (2025)
- AI VC Investment Trends — OECD (2026.02), Crunchbase, BestBrokers
- DeepSeek MoE Efficiency — DeepSeek-V3 Technical Report (arXiv), Epoch AI
- Korea HBM Market — TrendForce (2025), SK hynix FY25, Samsung FY2025
Related Posts
NVIDIA Tax — How GPUs Capture Most of AI's Profits
Dissecting NVIDIA H100's 88% margin structure, analyzing how the AI chip monopoly impacts the ecosystem, and examining 3 scenarios for disruption

Anatomy of the AI Market in 3 Layers — What the $660B Really Looks Like
First installment of a series analyzing the AI market across three layers: infrastructure ($500B+), platform ($18B+), and applications ($80B+)
Deepfake Detection $15B — Who Are the Real Buyers?
The real buyers driving Deepfake Detection toward $15B aren't security teams — they're BFSI KYC departments. Four-SaaS breakdown, Hong Kong incident impact, and the Korean KYC 2.0 mapping through data.