
Anatomy of the AI Market in 3 Layers - What the $660B Really Looks Like
How to Read AI Market Numbers
“AI market worth $XXX billion.” We see this number every day. But what exactly it includes varies significantly across reports and research firms.
Some estimates bundle GPU sales and cloud infrastructure together. Others mix in ChatGPT subscription revenue, enterprise AI tool sales, and VC investments. They all go by “the AI market,” yet the money spent on GPUs and the money spent on AI SaaS subscriptions are fundamentally different. The market where NVIDIA earns 88% gross margins on H100 GPUs and the market where AI SaaS products have a 40% GRR (Gross Revenue Retention) cannot be measured by the same yardstick.
That is why this series breaks the AI market into 3 distinct layers. We examine the estimated size, revenue structure, key players, and structural risks of each.
Breaking It Down Into 3 Layers
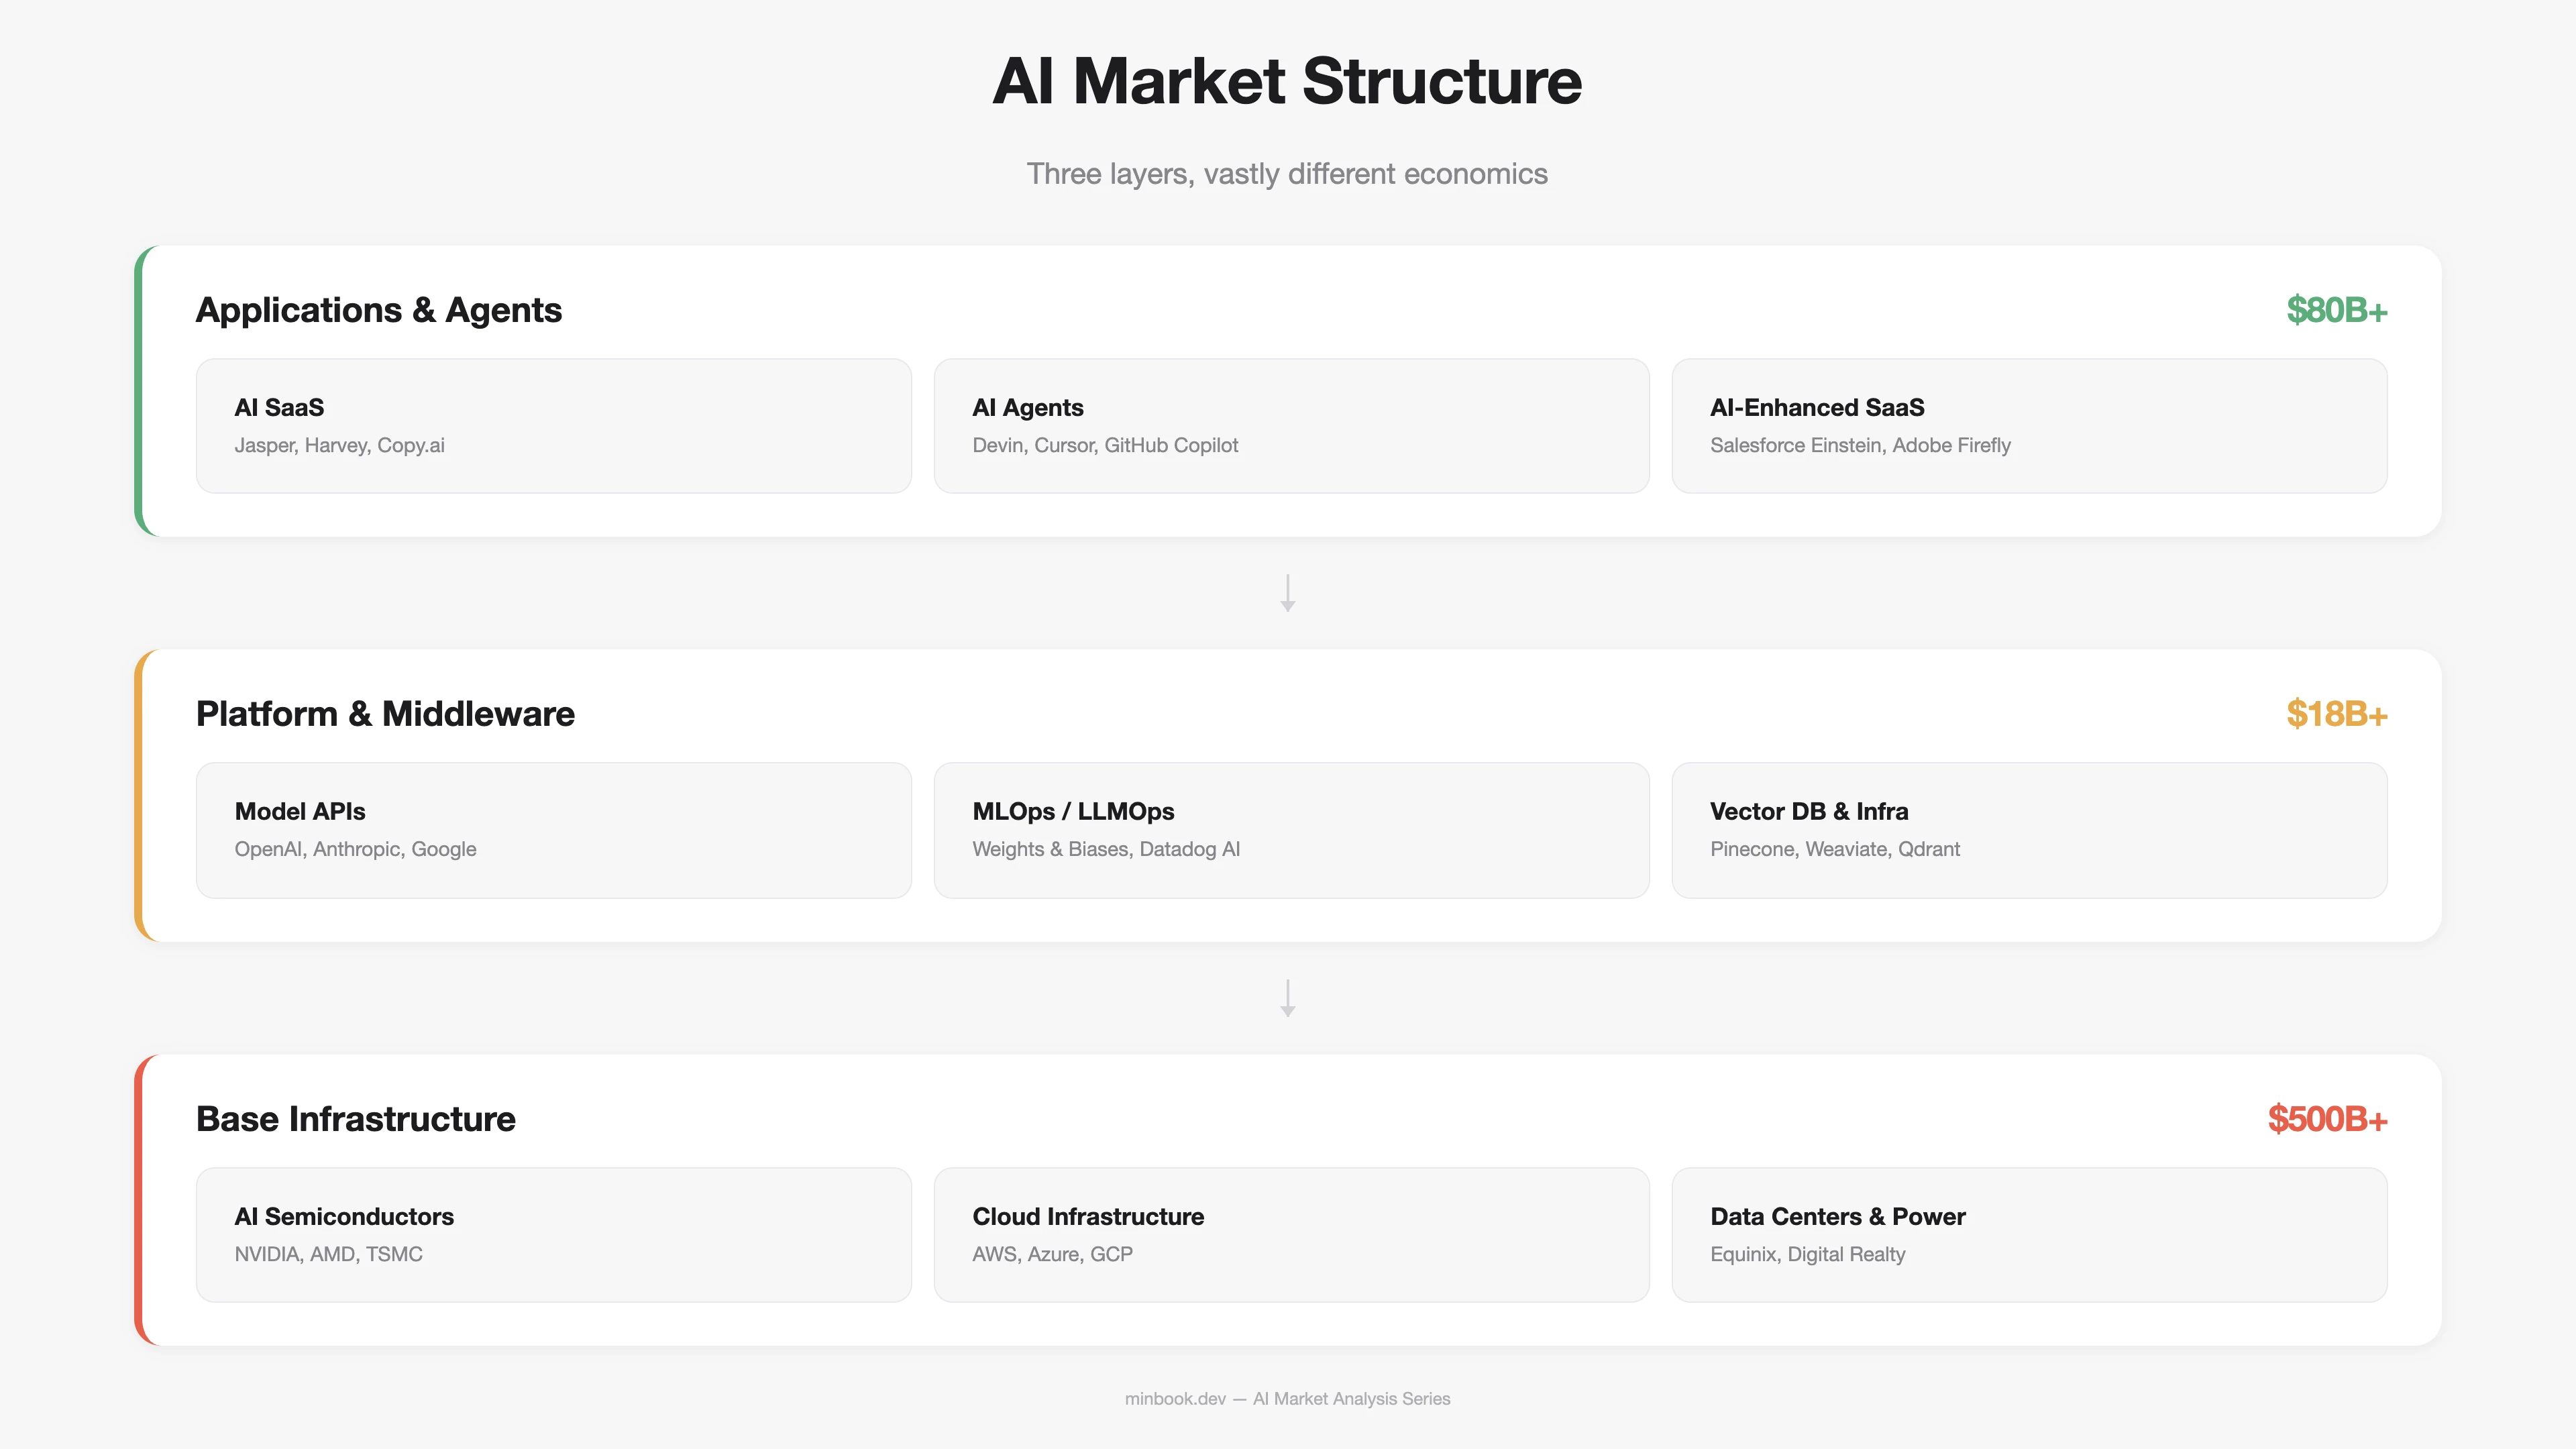
One of the most common approaches to analyzing the AI market is value-chain-based classification. Gartner, Goldman Sachs, a16z, and other institutions use similar frameworks. Here, we draw on these to define three layers: Infrastructure / Platform / Application. Each layer differs substantially in cost structure, competitive dynamics, and revenue model.
How the Money Flows Between Layers
The key thing to notice in this structure is the direction of money flow. In theory, end users pay for applications, that money flows through the platform layer, and ultimately funds infrastructure - creating a self-sustaining investment cycle. In today’s AI market, however, the money flowing into infrastructure is more than 6x larger than the money earned at the application layer. Whether this gap is simply a timing issue or a structural imbalance is the central question we will keep revisiting throughout this series.
The Base Infrastructure Layer - $500B+ Market
The infrastructure layer is the physical foundation that powers AI, encompassing semiconductors, cloud computing, data centers, and power infrastructure. It accounts for the largest share of the market by dollar value.
Scale and Composition
| Segment | Est. 2025 Size | Key Players | Concentration |
|---|---|---|---|
| AI Semiconductors (GPU/ASIC) | ~$150B+ | NVIDIA (87%), AMD, Intel, Broadcom | Extreme monopoly |
| AI Cloud Infrastructure (IaaS) | ~$200B+ | AWS, Azure, GCP (combined 65%+) | Oligopoly |
| Data Centers & Power | ~$150B+ | Equinix, Digital Realty, national utilities | Distributed |
NVIDIA’s data center revenue alone exceeds $100B annually ($115.2B in FY2025). AI cloud infrastructure has grown beyond $100B per quarter according to Synergy Research, tracking toward $400B+ annually. That said, the share specifically allocated to AI workloads varies widely by estimate, ranging from 40% to 60%.
Hyperscaler CapEx: Investment at Historical Scale
What ultimately determines the size of this layer is hyperscaler capital expenditure (CapEx). As of December 2025, the combined 2026 CapEx forecast for the top 5 hyperscalers (Microsoft, Google, Amazon, Meta, Oracle) stood at $602B. After February 2026 earnings reports, that figure was revised upward to $660B-$690B.
| Company | 2025 CapEx (Actual) | 2026 CapEx (Forecast) | Primary Use |
|---|---|---|---|
| Microsoft | ~$63B | ~$80B | Azure AI, OpenAI infrastructure |
| ~$55B | ~$75B | TPU, Gemini infrastructure | |
| Amazon | ~$75B | ~$100B | AWS Trainium, Bedrock |
| Meta | ~$37B | ~$65B | Llama training, AI inference |
| Oracle | ~$14B | ~$25B+ | OCI AI Cloud |
Put in historical context, these numbers are striking. Total telecom infrastructure investment during the 2000 dot-com era was roughly $500B in inflation-adjusted terms. Current AI infrastructure investment is surpassing that in a single year.
Roughly the same amount that accumulated over five years of telecom infrastructure investment during the dot-com bubble is now being repeated annually in AI. - IEEE Communications Society, 2025.12
Structural Characteristics of the Infrastructure Layer
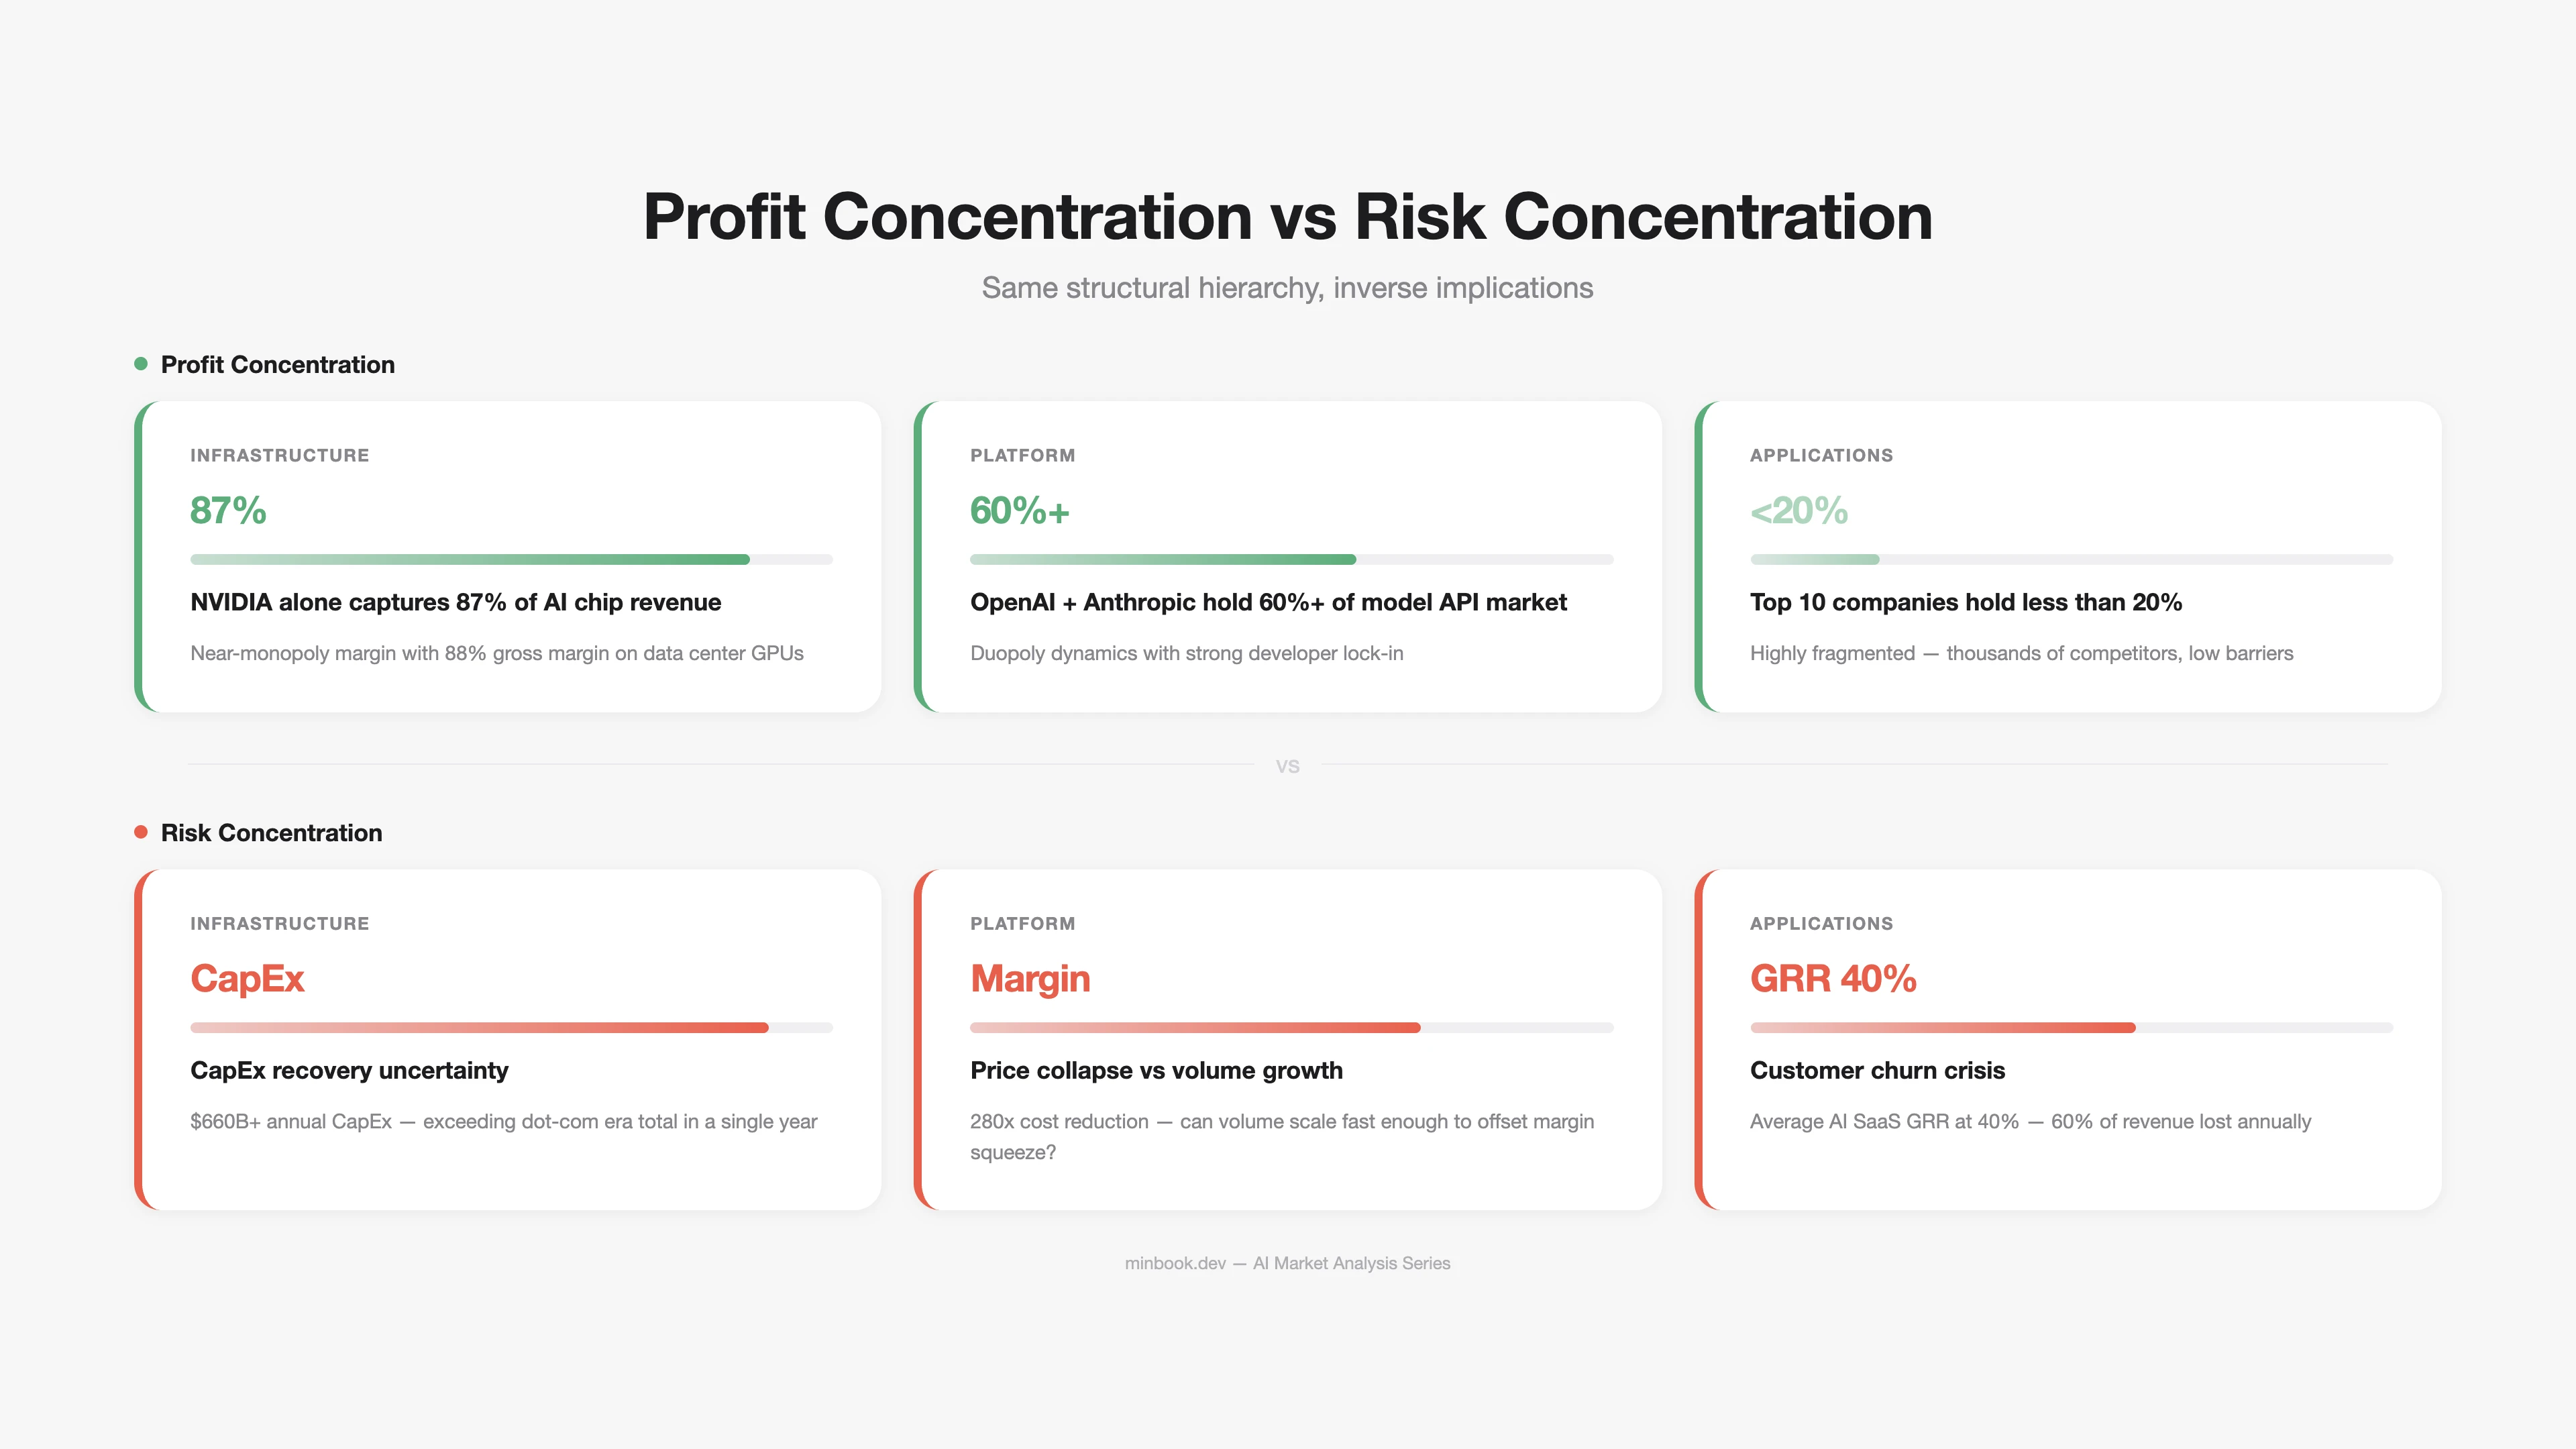
High concentration. NVIDIA commands 87% of AI accelerator market revenue (2024, Silicon Analysts). The H100 GPU has an estimated manufacturing cost of ~$3,320 and sells for ~$28,000, yielding a gross margin of 88%. That is software-grade margin, extraordinary for a hardware business.
High barriers to entry. Semiconductor design (NVIDIA), foundry manufacturing (TSMC), and cloud infrastructure (AWS/Azure/GCP) all require decades of accumulation and massive capital investment, making new entry extremely difficult.
Demand exceeds supply. While lead times for H100/H200/B200 GPUs have shortened, a demand-supply gap for the latest generation of GPUs persists.
The Platform & Middleware Layer - $18B+ Market
The platform layer is the tool ecosystem for building, deploying, and operating AI models. It includes model APIs, MLOps/LLMOps, vector databases, and fine-tuning platforms.
Scale and Composition
| Segment | Est. 2025 Size | Key Players | Growth Rate |
|---|---|---|---|
| Model APIs (Inference) | ~$8B+ | OpenAI, Anthropic, Google | 100%+ YoY |
| MLOps / LLMOps | ~$5B+ | Weights & Biases, Datadog AI, MLflow | 40-60% YoY |
| Vector DBs & Search | ~$2B+ | Pinecone, Weaviate, Qdrant | 80%+ YoY |
| Fine-tuning / Model Hubs | ~$3B+ | Hugging Face, Together AI, Replicate | 50%+ YoY |
Model APIs: Explosive Growth and Price Collapse - Simultaneously
The most notable phenomenon in this layer is a structure where revenue is surging while unit prices are plummeting.
OpenAI’s ARR went from $2B in 2023 to $20B by the end of 2025, and surpassed an annualized $25B as of February 2026. Anthropic hit $14B ARR in February 2026 and, with Claude Code’s contribution, surged to ~$19B by March.
At the same time, LLM inference costs have dropped 280x in 24 months. At GPT-3.5-level performance, the cost per million tokens fell from $20 in November 2022 to $0.07 in October 2024 (Stanford AI Index 2025).
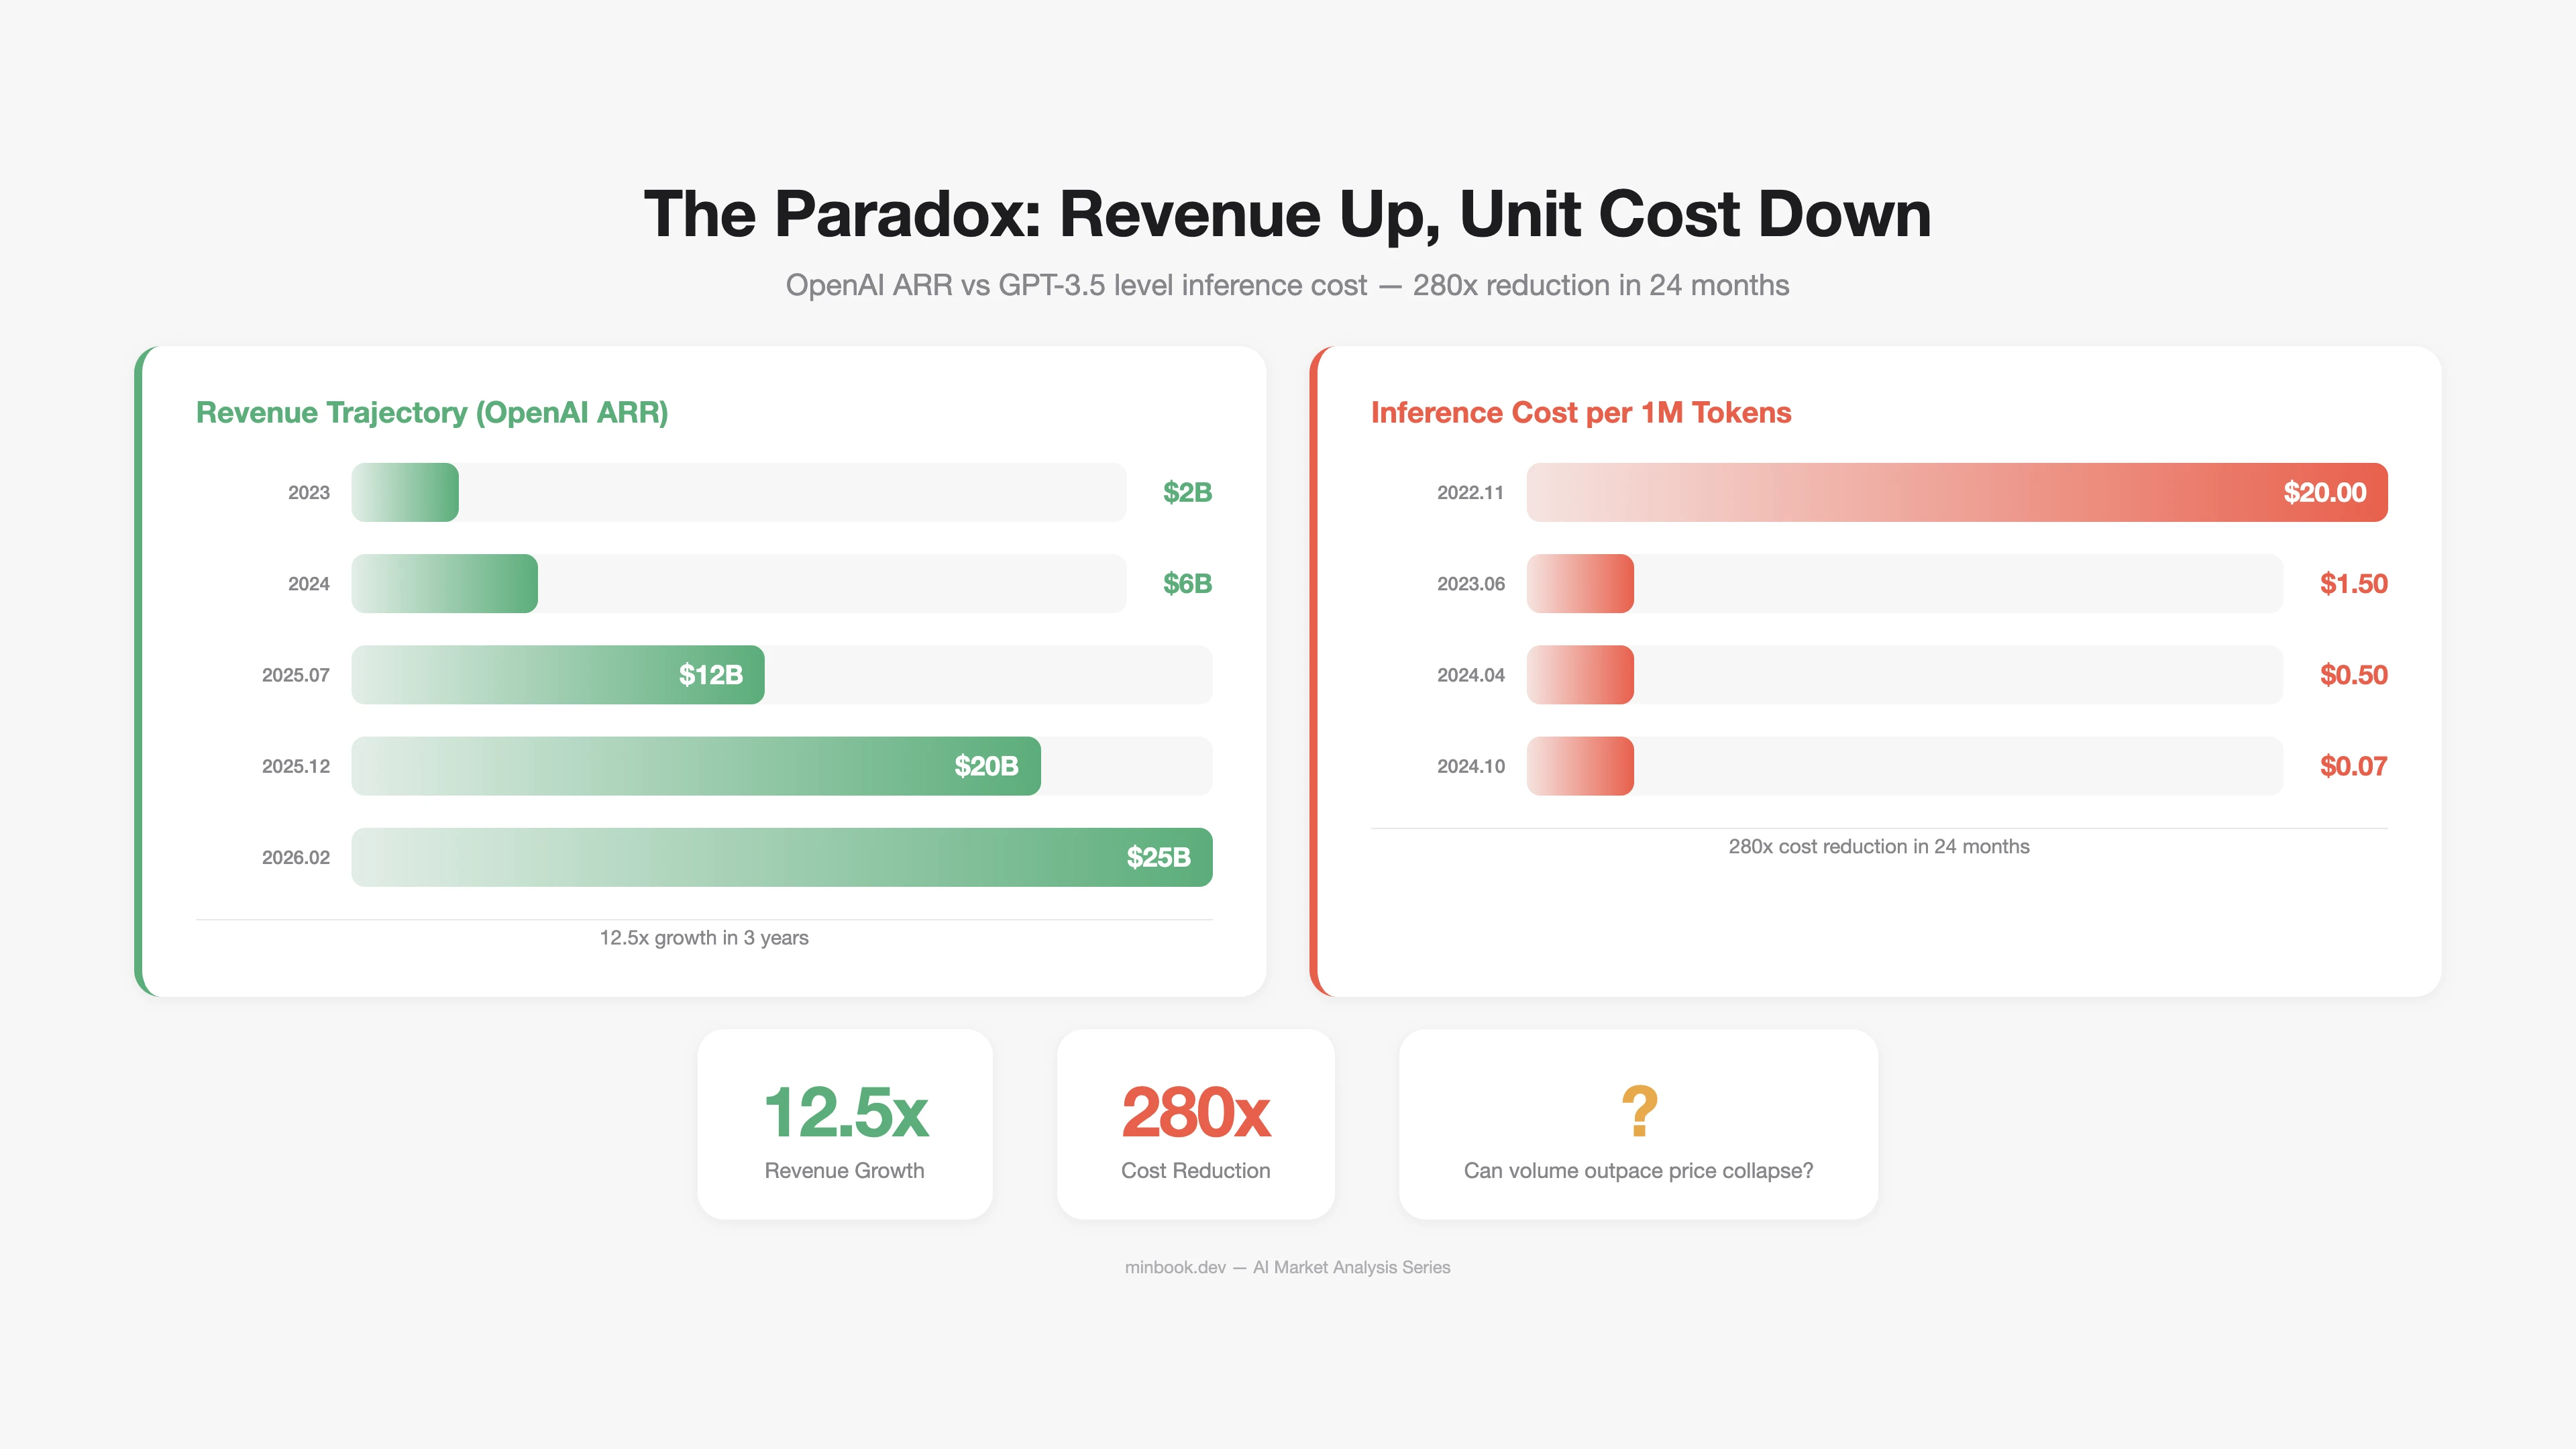
The paradox explained: Volume is outpacing the price decline. Per-token price is falling, but usage is growing exponentially, keeping total revenue on the rise. But can this structure last forever? What happens when the rate of price decline overtakes the rate of usage growth? This is the core risk for the platform layer, and we analyze it scenario by scenario in Part 5.
Structural Characteristics of the Platform Layer
Weak network effects. Cloud services in the infrastructure layer carry high switching costs once adopted. Model APIs at the platform layer, however, are relatively easy to switch. Going from OpenAI’s API to Anthropic’s is a matter of changing a few lines of code. This intensifies price competition and compresses margins.
Vertical integration pressure. Infrastructure-layer players (Google, Amazon, Microsoft) are expanding into the platform layer through their own models (Gemini, Nova, GPT series). Independent platform players (OpenAI, Anthropic) are responding by expanding into applications. The result is a platform layer under squeeze from both directions.
The Application & Agent Layer - $80B+ Market
The application layer is where end users actually pay for AI products and services. It includes AI-native SaaS, AI agents, and existing software with integrated AI capabilities.
Scale and Composition
| Segment | Est. 2025 Size | Representative Companies | Characteristics |
|---|---|---|---|
| AI-native SaaS | ~$15B+ | Jasper, Copy.ai, Harvey, EvenUp | 40% GRR, high churn |
| AI Agents / Copilots | ~$20B+ | GitHub Copilot, Cursor, Devin | Rapid growth, developer market leads |
| AI-enhanced Legacy SaaS | ~$45B+ | Salesforce Einstein, Adobe Firefly | Leveraging existing customer base |
Two Sides: High Expectations, Uncertain Revenue Durability
This layer is where the narrative “AI will reshape all software” plays out, which is why it attracts the most investor attention. Of the $270B in AI VC investment in 2025, a significant portion targeted this layer (52.7% of all VC went to AI-related companies, per BestBrokers).
However, revenue durability is a concern. According to ChartMogul’s 2025 report, the median GRR for AI-native SaaS is 40%. Compared to the 90%+ GRR of traditional SaaS, that is a significant gap. AI products priced below $50/month in subscription fees showed GRR dropping as low as 23%.
Why Is Application GRR So Low?
- Low switching costs. AI wrapper products lose their differentiation the moment the underlying model updates. When ChatGPT adds new features, dozens of startups built on top of it are instantly undermined.
- Free alternatives keep emerging. As open-source models (Llama, Mistral, Qwen) rapidly improve, the value proposition of paid AI SaaS weakens.
- The “Wow to Meh” pattern. The first experience is impressive, but once users discover limitations, they churn quickly. This expectation-reality gap is a distinctive feature of AI products.
The CIO Reality: 72% Below Break-Even
Gartner’s May 2025 survey (506 CIOs and technology leaders) found that 72% reported break-even or loss on AI investments. The primary cause: when purchasing a single AI tool, 10 hidden costs emerge beyond the license fee - data preparation, integration, training, change management, and more.
Revenue Structure Comparison Across All 3 Layers
Placing the key financial metrics of all three layers side by side reveals their distinct economic characters.
| Metric | Infrastructure | Platform | Application |
|---|---|---|---|
| Market Size | $500B+ | $18B+ | $80B+ |
| Representative Margin | NVIDIA 88% (GPU) | OpenAI est. -20-30% | AI SaaS avg. 60-70% (gross) |
| Customer Retention | Very high switching cost | Medium (easy API switching) | Very low (40% GRR) |
| Competitive Intensity | Monopoly/Oligopoly | Intense price competition | Extremely fragmented, low barriers |
| Revenue Predictability | High (long-term contracts) | Medium (usage-based) | Low (high churn) |
| Payback Period | 3-7 years (infra depreciation) | 1-3 years | 6 months-2 years |
The Structural Imbalance of the AI Market
The “Inverted Pyramid” Problem
In traditional technology markets, infrastructure investment comes first, platforms form on top of it, and applications ultimately generate the revenue that recoups the infrastructure investment. The internet followed this pattern. Mobile followed it. Cloud followed it.
The AI market has this structure inverted.
| Infrastructure Investment (Annual) | Application Revenue (Annual) | Ratio | |
|---|---|---|---|
| Internet (2000) | ~$100B | ~$30B | 3.3:1 |
| Cloud (2015) | ~$50B | ~$40B | 1.25:1 |
| AI (2026) | ~$660B+ | ~$80B | 8:1 or higher |
The AI infrastructure-to-application revenue ratio exceeds 8:1, wider than the 3.3:1 of the dot-com era. Simple comparisons have their limits, of course, but the implication is clear - whether the application layer can grow its revenue to a level that justifies infrastructure investment is the central question.
But This Time Could Be Different
The bearish case is not the only one. There are three reasons why the AI market may differ from previous technology cycles.
-
Enterprise demand already exists. Dot-com-era infrastructure investment was for “demand that would come someday.” AI infrastructure investment is happening because GPUs are currently in short supply. Demand is preceding investment.
-
Hyperscalers have different financial capacity. In 2000, telecom companies built infrastructure on debt. Today’s top 5 hyperscalers hold combined cash reserves exceeding $500B. They can fund a significant portion of CapEx from their own balance sheets.
-
AI inference costs are falling rapidly. A 280x decline in 24 months is faster than Moore’s Law. If cost declines continue, enterprise demand currently blocked by cost constraints could be unlocked explosively.
Sources
- NVIDIA FY2025 Earnings - NVIDIA 10-K Filing (SEC), Data Center Revenue $115.2B
- Hyperscaler CapEx Forecasts - IEEE Communications Society (2025.12), CNBC (2026.02), Futurum Group (2026.02)
- LLM Inference Cost Decline - Stanford AI Index Report 2025, a16z “LLMflation”
- OpenAI ARR - PYMNTS (2026.01), OpenAI CFO Sarah Friar
- Anthropic ARR - SaaStr (2026.02, $14B), Yahoo Finance (2026.03, ~$19B)
- AI SaaS GRR 40% - ChartMogul “SaaS Retention: The AI Churn Wave” (2025.09)
- AI VC Investment - OECD (2026.02, $258.7B/61%), BestBrokers ($270.2B/52.7%)
- CIO AI Investment ROI - Gartner Newsroom (May 2025 survey, n=506)
- NVIDIA AI Accelerator Market Share - Silicon Analysts
- H100 Cost/Margin Analysis - Jarvislabs, Cyfuture Cloud
Related Posts
NVIDIA Tax - How GPUs Capture Most of AI's Profits
Dissecting NVIDIA H100's 88% margin structure, analyzing how the AI chip monopoly impacts the ecosystem, and examining 3 scenarios for disruption

Where AI Value Accrues: Benedict Evans and Jensen Huang's Two Maps
Evans and Jensen both treat the model as a commodity, then split on whether value flows up to apps or down to infrastructure

2027 AI Market Scenarios - Where Does the $660B Go?
Three-scenario analysis (Bull/Base/Bear) of the AI market's $660B CapEx and survival strategies by segment