
The 'Europe Is Behind' Illusion — EU and US AI Automation Are Nearly Identical, the Real Gap Is Elsewhere
Automation potential across 10 European countries differs from the US by only 1 percentage point. The real gap comes from adoption pace and country-level variance. AI fluency demand surged 5×, and the Skill Change Index reveals an exposure map across skills.
When Conventional Wisdom and Data Diverge
“Europe is behind the US in AI.” This sentence appears in coverage almost weekly. The narrative: Big Tech is headquartered in the US, more than 60% of AI startup capital concentrates in Silicon Valley, and Europe is more conservative under regulatory frameworks like the AI Act. So it is natural to assume that automation adoption pace, employment impact, and skill reshuffling also lead in the US.
But the 86-page report Agents, robots, and us: How AI reshapes work and skills in Europe, published by the McKinsey Global Institute in May 2026, directly challenges this premise. Automation potential across 10 European countries and the US turned out to be nearly identical, and job-structure distributions are strikingly similar. Even AI fluency demand growth was the same — exactly 5× on both sides.
So where does the perception that “Europe is behind” come from, and where is the real gap? That is the starting question of this post. Next — when the premise that automation simply replaces jobs collapses, what capability do workers actually need? Finally — how does McKinsey’s own Skill Change Index (SCI) show which everyday skills are most exposed to automation and which remain a human premium?
We examine the three questions in turn.
1. Automation Potential — Nearly Identical Between EU and US
McKinsey analyzed 10 European countries (Czech Republic, Denmark, France, Germany, Italy, Netherlands, Poland, Spain, Sweden, United Kingdom), which cover more than 75% of European workforce and GDP. They decomposed about 800 occupations per country into O*NET-based detailed work activities (DWAs), mapped about 10,500 skills using Lightcast occupation and job-posting data, and applied McKinsey’s own automation adoption model.
The results:
| Metric | EU 10 | US | Diff |
|---|---|---|---|
| Share of current work hours technically automatable | 58% | 57% | +1pp |
| Of that, share addressable by Agents (non-physical) | 44pp | 44pp | Same |
| Of that, share addressable by Robots (physical) | 14pp | 13pp | +1pp |
| Share of non-physical activities | 67% | ~67% | Same |
| People-centric job share | 31% | 34% | -3pp |
| Hybrid roles (human + Agent/Robot) | 27% | 27% | Same |
| AI-centric job share | 42% | 40% | +2pp |
A one-percentage-point gap is statistically close to noise. In other words, the claim that Europe lags the US in the sheer volume of automatable work is not supported by the data. The only meaningful difference is that People-centric roles are 3pp smaller in Europe, which is why Europe’s automation potential comes out marginally higher.
The 7-Archetype Framework — How Roles Distribute Across People, Agents, and Robots
The 7-archetype framework McKinsey introduced is the report’s most powerful analytical lens. Roles are categorized by the share of human, Agent, and Robot contribution.
flowchart LR
  A[All Roles 100%] --> B[People-centric 31%]
  A --> C[Hybrid Roles 27%]
  A --> D[AI-centric 42%]

  C --> C1[People–Agent 21%]
  C --> C2[People–Robot 1%]
  C --> C3[People–Agent–Robot 5%]

  D --> D1[Agent-centric 30%]
  D --> D2[Robot-centric 8%]
  D --> D3[Agent–Robot 4%]
People-centric roles include cleaning and facility staff, operations managers, and nurses — jobs where human judgment, relationships, and context are core. Hybrid roles place humans at the center while ceding parts of the workflow to machines — retail sales, schoolteachers, financial managers, plumbers, and medical assistants are typical. AI-centric roles include administrative assistants, accountants, software developers, packagers, and security screeners — jobs heavy in structured, codified tasks.
Notably, the US and EU both show Hybrid roles at exactly 27%. That is, roles where humans collaborate with machines exist in equal share across both regions. AI-centric roles are also close: EU 42% vs US 40%.
So Where Does the “US Is Ahead” Perception Come From?
Two sources. One is capital market visibility — AI startup funding, IPOs, and Big Tech market caps overwhelmingly favor the US. The other is consumer perception — flagship products like ChatGPT, Claude, and Gemini are all US companies. But the actual volume of automatable work in the labor market is nearly identical across the two regions. That is the report’s most provocative finding.
2. Where the Real Gap Lies — Adoption Pace and Country-Level Variance

If convergence holds at the macro average, where does the gap appear? Two places — adoption pace and country-level variance.
Adoption Pace — $1.9T vs $1.1T
McKinsey modeled two scenarios for economic value unlockable by 2030.
| Scenario | 2030 Value | Assumption |
|---|---|---|
| Midpoint | $1.9T | Historical tech-diffusion pattern applied |
| Gradual | $1.1T | Adoption delayed |
| Pure technical potential (reference) | $5.5T | Time constraint removed |
The $800B gap is not due to technical limitations but to the speed of adoption decisions. The report cites a striking statistic: “90% of companies report regularly using AI, but fewer than 40% see measurable impact.” Adoption is fast, but realized impact is small, and the cause is the absence of workflow redesign.
Two cases McKinsey cites:
- A global tech firm automated the early stages of the sales cycle (lead qualification, first-touch outreach) with AI Agents. Sales personnel could then redirect time toward relationship management and strategic deals.
- A pharmaceutical company has AI draft clinical documents. The medical writer’s role shifted from “drafting” to “review, integrity assurance, and regulatory compliance.”
Both cases were not single-task AI insertions. They compressed handoffs, removed coordination layers, and redefined roles. That is what real value realization looks like.
Country-Level Variance — UK 8.9× vs Netherlands 1.8×
The variance among the 10 European countries is far larger than the EU–US average gap. The table below sorts countries by AI fluency demand growth multiplier (2023 Q4 → 2025 Q4 job postings).
| Country | Automation Potential | 2030 Economic Value | AI Fluency Multiplier | Note |
|---|---|---|---|---|
| 🇬🇧 United Kingdom | 54% | $375B | 8.9× | Lowest potential / Highest human-capital shift |
| 🇵🇱 Poland | 61% | $105B | 7.5× | Manufacturing & logistics + surging AI demand |
| 🇩🇪 Germany | 59% | $486B | 6.1× | Largest EU market + fast fluency diffusion |
| 🇨🇿 Czech Republic | 64% | $33B | 4.9× | Highest potential but average adoption pace |
| 🇪🇸 Spain | 59% | $167B | 4.4× | Retail, manufacturing, public-service centric |
| 🇸🇪 Sweden | 56% | $63B | 4.1× | Deepest day-to-day AI skill integration |
| 🇫🇷 France | 57% | $238B | 4.0× | Average |
| 🇩🇰 Denmark | 58% | $66B | 3.6× | Largest healthcare share |
| 🇮🇹 Italy | 60% | $196B | 2.3× | High potential, low adoption — the real risk zone |
| 🇳🇱 Netherlands | 57% | $152B | 1.8× | 70% non-physical, yet lowest AI demand growth |
| EU average | 58% | $1,880B | 5.0× | — |
| 🇺🇸 US (reference) | 57% | — | 5.0× | Matches EU average |
UK, Poland, and Germany sit well above the EU average of 5.0×. Italy and Netherlands sit at less than half the average. In other words, “Europe” as a single label looks similar to the US, but unpacked country by country, some exceed the US average and others fall below half.
Italy’s position is particularly interesting. At 60% automation potential it sits near the top of Europe, yet AI fluency demand grew only 2.3×, near the bottom. High potential paired with slow adoption — the country closest to McKinsey’s “gradual” scenario. Such countries risk a widening GDP gap against their peers.
Industry Composition Also Determines Value
Even at identical automation rates, the value unlocked depends on which industries dominate. The gap between Germany’s $486B and Czech’s $33B reflects industry scale and wage levels, not the automation-potential gap (59% vs 64%).
Another important finding: 82% of automation value comes from Agents. Robots account for only 18%.
| Sector | Agent Share | Robot Share | Value |
|---|---|---|---|
| Finance & Insurance | 95% | 5% | $84B |
| Educational Services | 94% | 6% | $139B |
| Professional Services | 93% | 7% | $179B |
| Manufacturing | 71% | 29% | $322B |
| Accommodation & Food | 66% | 34% | $67B |
| Overall average | 82% | 18% | $1,880B |
Even manufacturing is 71% Agent-driven — because planning, quality control (QC), procurement, and supply-chain coordination (all non-physical) carry significant weight. The implication: from a capital-efficiency standpoint, investment in software + workflow redesign delivers higher ROI than robotic CapEx.
3. The Age of AI Fluency — 5× Surge, 5% Occupational Penetration
The report’s second core finding is that AI-related skill demand has not merely increased — a new category called “AI fluency” has surged 5×.
AI Fluency vs Technical AI — What’s the Difference?
McKinsey distinguishes two categories of AI skills.
| Category | Definition | Target Roles | 2023→2025 Multiplier |
|---|---|---|---|
| AI fluency | Ability to use, manage, integrate, and judge AI systems. Not engineering. Includes prompting, workflow integration, output interpretation, human-review judgment | Broad — general office workers, sales, managers, HR, compliance | 5.0× |
| Technical AI | Ability to build, deploy, and govern AI systems. Model design, infrastructure, safety and reliability assurance | STEM-centric — Computer & Math roles | 1.7× |
This distinction matters because — AI fluency does not mean you must become an engineer. It is the digital literacy of the AI era. Just as 1990s office workers had to know Word and Excel, 2026 workers must be able to integrate AI tools into their daily workflows.
The Numbers — And the Most Important Signal
Hiring-demand changes calculated by McKinsey in Exhibit 9 from 2023 to 2025 (in millions, EU-10 combined, criteria: occupations where AI-related skills appear in at least 5% of job postings):
| Category | 2023 | 2025 | Multiplier | STEM/Non-STEM Composition |
|---|---|---|---|---|
| AI fluency (use & manage) | 1.9M | 9.4M | +5.0× | Non-STEM accounts for more than half of absolute growth |
| Technical AI (build & govern) | 2.0M | 3.3M | +1.7× | STEM-centric, small Non-STEM share |
| Any AI-related skills | 2.8M | 9.9M | +3.6× | Non-STEM diffusion accelerating |
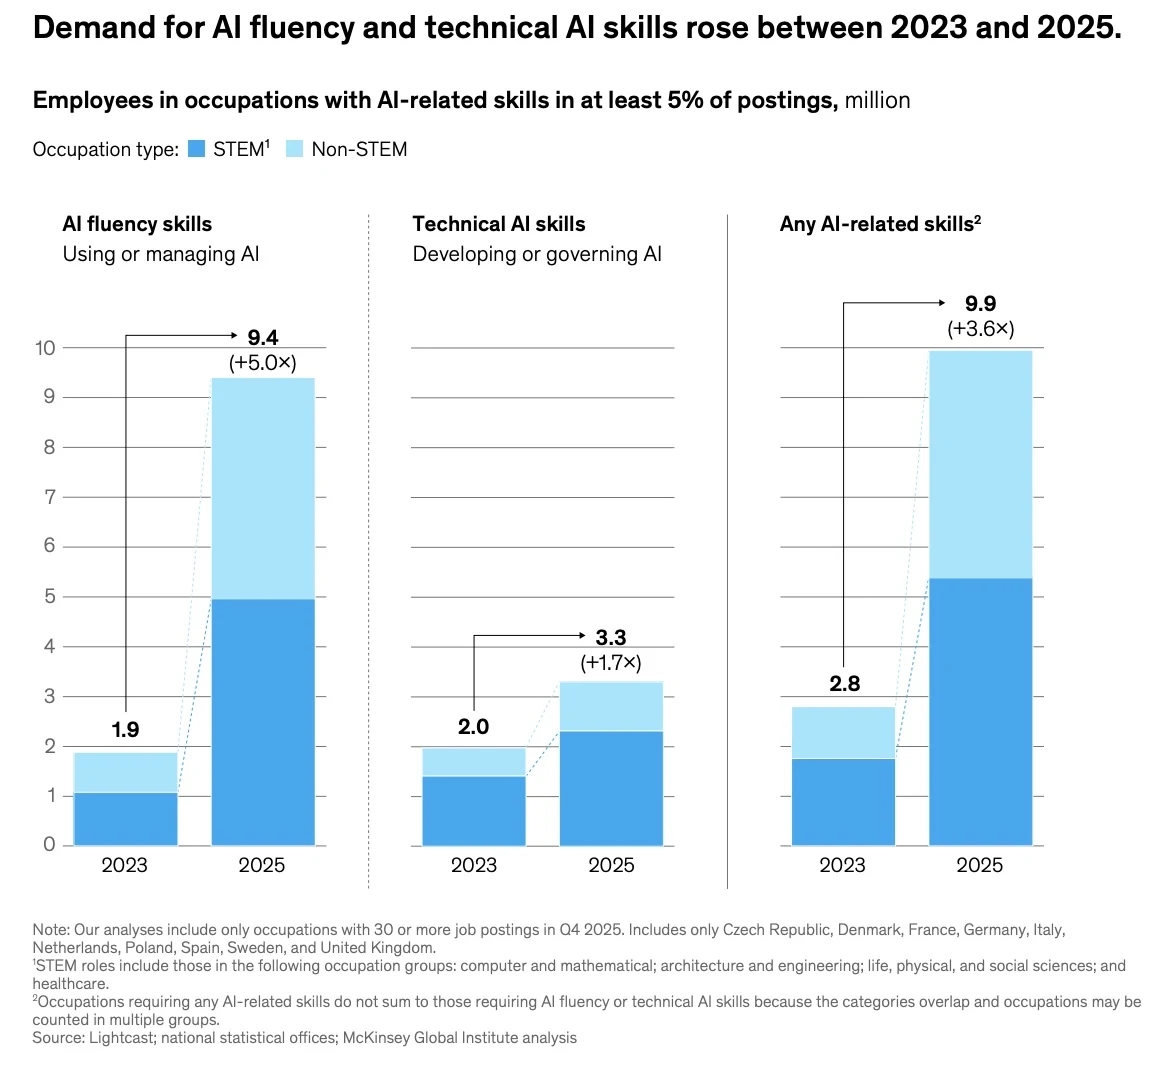
Here, the strongest signal is the internal composition of the AI fluency surge. Of the ~7.5M growth from 1.9M to 9.4M, more than half occurs in Non-STEM roles. In other words, demand for the ability to integrate AI tools into everyday workflows is exploding outside Computer, Math, and Engineering roles.
By contrast, Technical AI (model building and governance) grew only 1.7× from 2.0M to 3.3M, concentrated in STEM roles. The pool of people who build models remains a small engineering set, while the pool of people applying models to everyday work is spreading across all roles.
What this asymmetry means is that — “learn to code to survive the AI era” is a misleading prescription. For most workers, the urgent learning curve is not Python or ML theory, but the ability to insert AI tools into their domain workflows and critically validate outputs — AI fluency.
Occupational Diffusion — Penetrating Non-Technical Roles
75% of demand still concentrates in three occupational groups.
- Computer & Math (60% of total workforce in this group requires AI skills) — 4.5M
- Management (10%) — 1.8M
- Business & Financial Operations (12%) — 1.2M
But the remaining 25% disperses broadly across 16 other groups. The report observes that job postings for logistics coordinators, HR specialists, compliance officers, and skilled tradespeople increasingly require familiarity with AI tools and analytic platforms.
“In these contexts, AI is not replacing domain expertise but changing how it is applied.” — McKinsey, Agents, robots, and us, 2026
Not replacing expertise, but changing how it is applied. This framing is the report’s most important message.
The Rise of Complementary Skills
Some skills are growing in demand faster than AI skills themselves.
| Fastest-growing skills (job-posting demand index) | Fastest-declining skills |
|---|---|
| Business Analysis (+176) | Language Competency (-39) |
| Personal Attributes (+155) | Office Equipment & Technology (-37) |
| Quality Assurance & Control (+148) | Operating Systems (-19) |
| Process Improvement & Optimization (+147) | Physics (-14) |
| AI & Machine Learning (+143) | Java (-11) |
| Regulation & Legal Compliance (+118) | Pharmacy (-10) |
| Critical Thinking & Problem Solving (+109) | Mathematics (-9) |
| People Management (+109) | — |
Demand for business analysis, quality assurance, and process improvement — complementary skills — is growing faster than pure AI/ML. The reason is simple — for AI to work, someone must precisely define the business problem, someone must validate the output, and someone must redesign the workflow. This is the new mid-skill role of the AI era.
When companies plan reskilling budgets, investing in BA, QC, and process-improvement capability yields higher ROI than AI/ML training itself.
4. The Skill Change Index — Which Skills Get Exposed?
The third core instrument the report offers is the Skill Change Index (SCI). For each of ~10,500 skills, it produces a 0–100 score reflecting exposure to automation through 2030.
How SCI Is Calculated
- Map each skill to detailed work activities (DWAs)
- Compute time-weighted automation adoption rates for those DWAs
- Aggregate adoption rates across occupations, industries, and countries
- Normalize to a 0–100 scale
A higher score means the activities that skill supports are more exposed to automation.
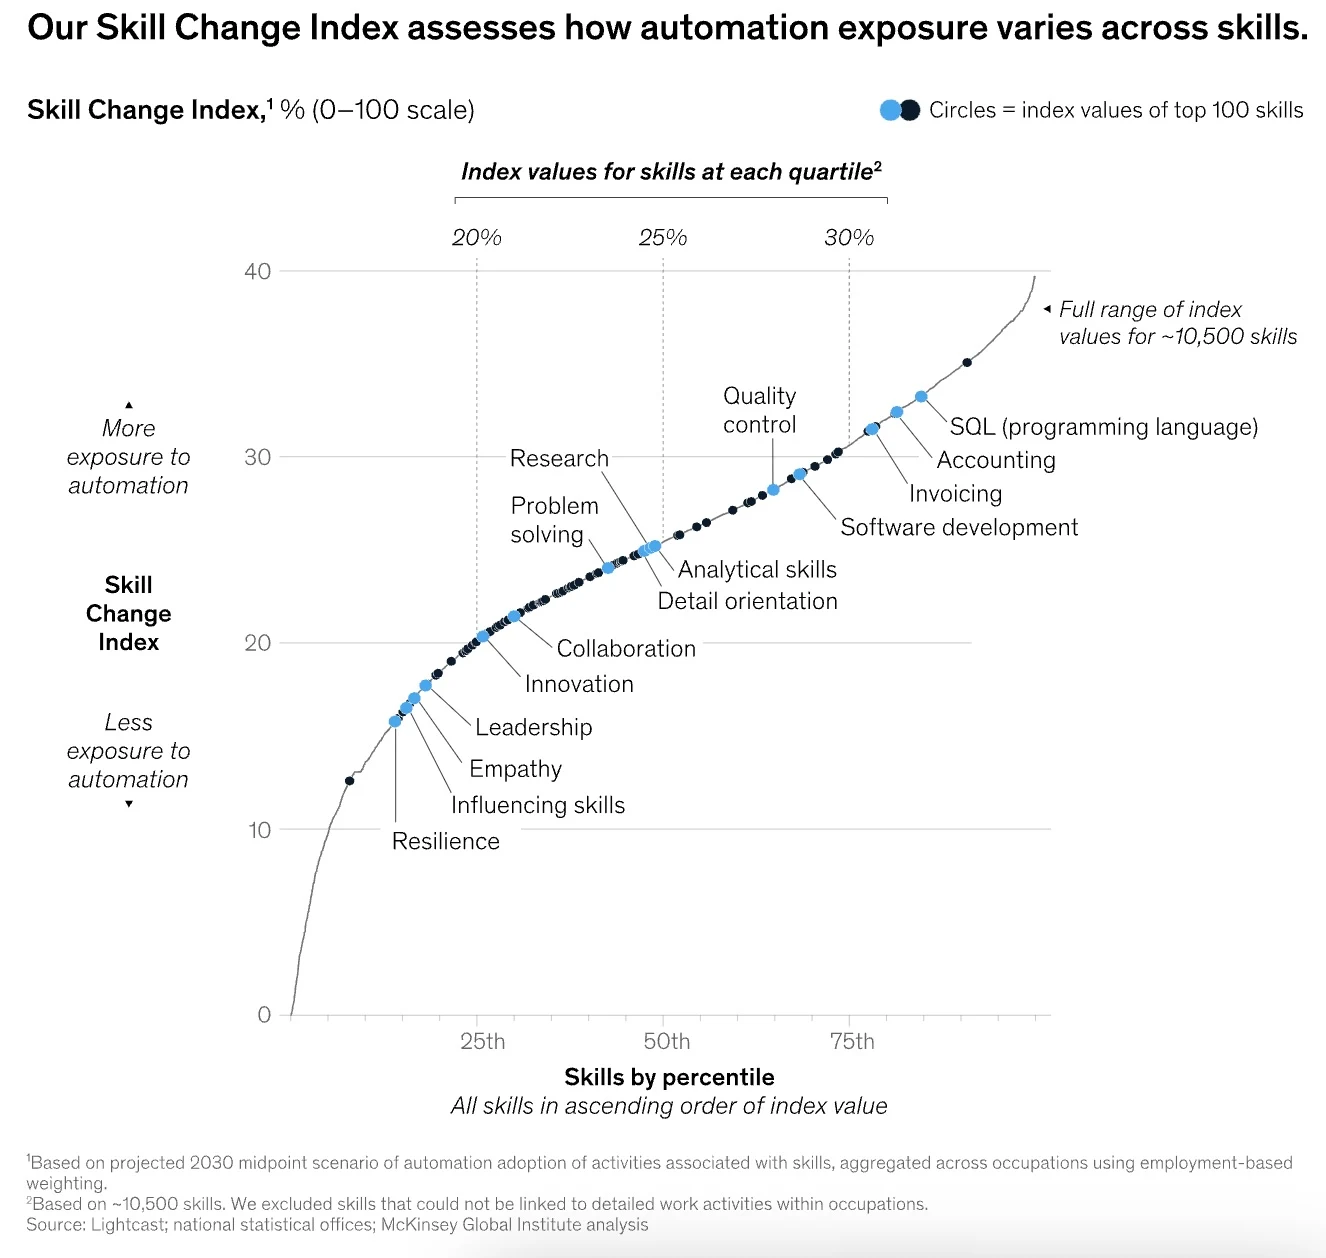
The curve’s key insight — most skills cluster between 0 and 30, and skills with extreme exposure are a minority. Contrary to the popular notion that “AI is eating every skill,” exposure is highly asymmetric.
Skill Map by Exposure Level
| High exposure (heavily exposed) | Mid | Low exposure (human premium retained) |
|---|---|---|
| SQL (programming language) | Quality Control | Resilience |
| Accounting | Research | Empathy |
| Invoicing | Problem Solving | Leadership |
| Software Development | Analytical Skills | Influencing Skills |
| Routine Data Entry | Detail Orientation | Coaching |
| Programming Languages | Collaboration | Negotiation |
| Mechanical Aptitude | Innovation | Clinical Decision-Making |
| Operating Machinery | — | Teaching |
Notably, SQL and software development — long classified as “tech skills” — sit in the high-exposure tier. This is because coding assistants like GitHub Copilot, Cursor, and Claude Code have spread rapidly, and simple code-generation work now accounts for a significant share of automation. This does not mean programmers disappear — it means a programmer’s job shifts from “writing code” to “reviewing code, designing architecture, and integrating systems”.
By contrast, leadership, empathy, negotiation, and teaching — human-centric skills — sit in the low-exposure tier. These are areas AI augments but does not replace.
So Do Skills Disappear? — The 75% Message
If SCI shows a continuous distribution of exposure, McKinsey also simplifies the same 10,500 skills by their association with automation activities. This classification carries the report’s single most important message.
- People-led 10% — Skills mainly used in non-automated activities. Leadership, clinical judgment, negotiation, conflict resolution. Almost no displacement risk.
- Shared 75% — Skills used in both automated and non-automated activities. Not disappearing, but transformed in how they are applied alongside AI.
- AI-led 15% — Skills mainly used in automated activities. Over time, embedded into Agent and Robot workflows.
The core is the middle 75%. Most of the skills we use daily are not disappearing — they are changing how they are applied.
Examples from McKinsey:
- Language competency: When AI Agents draft multilingual responses, humans verify accuracy and cultural nuance.
- Quality assurance (QA): When automated systems flag defects and anomalies, humans handle corrections and regulatory compliance.
“Skills could be reshaped through collaboration between people and AI rather than replaced outright.” — McKinsey, Agents, robots, and us, 2026
Reshaped, not replaced. This is the report’s single most important message.
5. The Korean Market — How to Read This Data
McKinsey’s report covers 10 European countries, but the analytical framework applies directly to Korea. The data infrastructure differs, however.
| Report data source | Korean equivalent |
|---|---|
| O*NET (US occupational and work-activity database) | KEIS occupation classification + Korean Dictionary of Occupations |
| Lightcast (global job-posting data) | Unified data from Jobkorea, Saramin, Worknet |
| ESCO (European skills classification) | Mapping to NCS (National Competency Standards) required |
| BLS (US Bureau of Labor Statistics) | Statistics Korea EAPS + Ministry of Employment and Labor |
Patterns Expected in Korea
Applying the report’s data to Korea yields the following hypotheses.
- People-centric job share likely higher in Korea — Services, caregiving, and education weigh heavily, and self-employment is above the OECD average. US 34% vs Korea estimate 35–40%.
- AI fluency demand multiplier likely bifurcates — Large enterprises and IT roles may approach US levels (5×), but SMEs and traditional industries may resemble Italy (2.3×) or Netherlands (1.8×).
- Country-single average is an illusion — Korea may macro-appear as an “AI laggard,” but industry- and firm-size variance could exceed the US/EU.
Decision Points for Business Leaders
What the report implies for Korean business leaders:
- Decompose the “AI laggard” perception to the micro level — Measure automation potential at the role/task level within your industry and function. Averages are useless.
- Invest in Agents + workflow redesign before robotic CapEx — 82% of automation value lies in the digital layer. Even in manufacturing.
- Extend AI fluency training to all employees — Technical AI is a niche engineering function; AI fluency is the digital literacy of every role. Approach it like the universal Excel training of 5 years ago.
- Complementary skill investment delivers higher ROI — Investing in mid-skills like BA, QC, process improvement, and compliance outperforms simple AI tool deployment.
- Use the Skill Change Index to diagnose your workforce — Identify which roles and skills sit in the high-exposure tier, and design a 5-year reskilling roadmap on top of SCI.
Closing — “Outcomes Are Not Fixed”
There is a striking line near the report’s conclusion:
“This is not the first technological revolution. As with previous shifts, some roles and activities are likely to decline even as others emerge. The outcomes are not fixed. Choices made now by companies, policymakers, and educators will shape how AI adoption unfolds and how workers adapt.”
Technology itself does not determine the outcome. The outcome is determined by the choices made now in companies, policy, and education.
That EU and US automation potential are nearly identical means, ultimately, that whoever redesigns workflows first, reskills workers first, and integrates the Agent layer into core processes first creates the gap of the next five years. The essence of the gap is not technology, but decision-making.
The same applies to Korea. Rather than accepting the “AI lag” self-fulfilling prophecy, draw the automation map of your own company and industry at the micro level. The three tools this report offers — the 7-archetype framework, the AI fluency definition, and the Skill Change Index — are directly applicable to diagnosing the Korean workforce.
Skills do not disappear. The way they are applied changes. And some companies will design that change first.
References
- McKinsey Global Institute, Agents, robots, and us: How AI reshapes work and skills in Europe, May 2026 (86 pages)
- Companion report: Agents, robots, and us: Skill partnerships in the age of AI, US edition, November 2025
- All figures and analysis in this post are drawn from the two reports above.
Related Posts

HubSpot, Semrush, Adobe, and Conductor Enter GEO — How Incumbents Are Moving
Analysis of major players entering the GEO market (SearchGPT, Perplexity, Google AI Overviews), their response characteristics, and step-by-step response strategies for enterprises.

GEO Agency and Consulting Market Overview
Analysis of four revenue models in the GEO agency and consulting market, risk mitigation strategies for search engine updates, and the necessity of transitioning to tech-driven SaaS.

South Korea's AI Market Today — Where to Double Down, Where to Rethink
A structural analysis of South Korea's AI strengths and weaknesses, the impact of the AI Basic Act, and five areas where the country can realistically compete