
AI eats the world 2026 — Reading Benedict Evans' 79-slide deck
In May 2026, at SuperAI 2026 in Singapore, Benedict Evans gave a 79-slide deck titled “AI eats the world.” Since the 2022 release of ChatGPT we’ve heard “this time AI is different” many times. Evans pushes that line back through 1995 internet, 2007 mobile, and earlier mainframes and PCs. Each platform shift was indeed different, just in a different way each time.
The deck is built on a three-chapter frame: Capital · Deployment · Change. How capital exploded, how deeply that capital actually deployed into the market, and what change followed. This piece walks through each chapter’s key numbers, quotes, and charts, and asks what single question is left when the data is stacked into one row. Across the 79 slides the one question that keeps returning is: “how should we read the gap between infrastructure boom and value capture?“
1. CAPITAL — A capital-spending explosion
$700B CapEx — a new yardstick
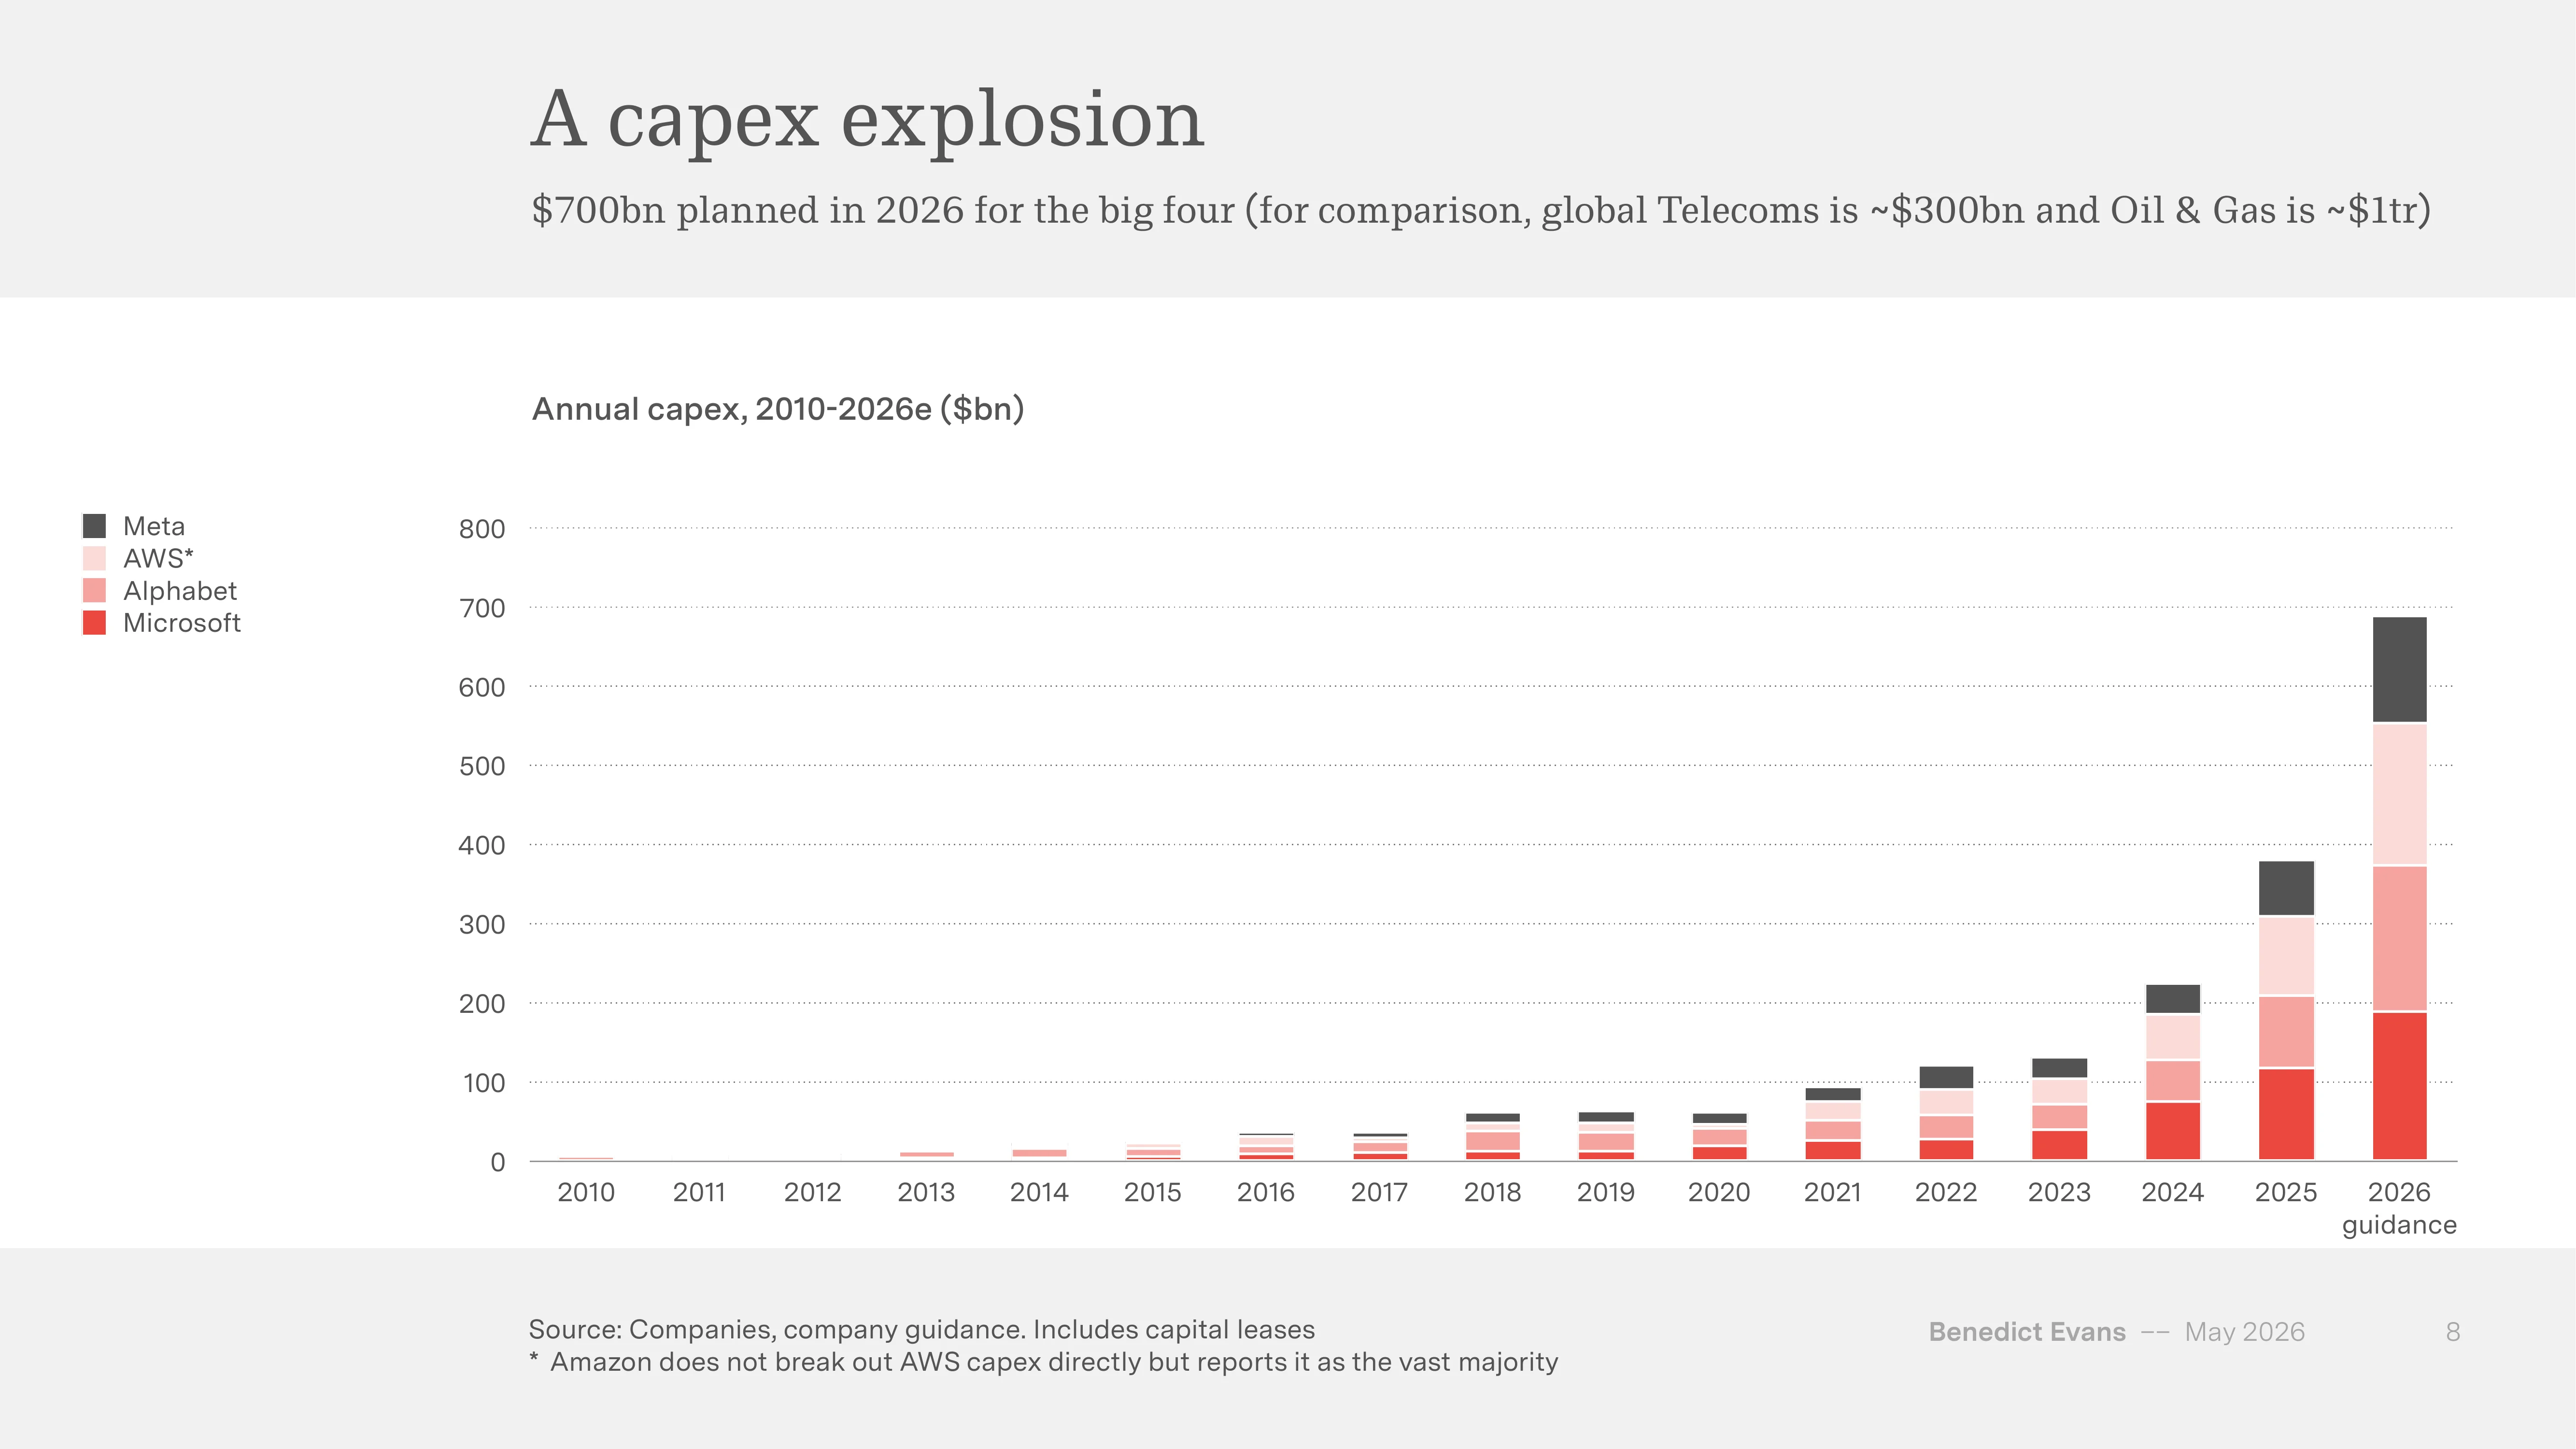
The first number that lands is the combined capital expenditure (CapEx, Capital Expenditure) of the Big 4 in tech. Meta, Microsoft, Alphabet and AWS’ 2026 CapEx guidance adds up to about $700B. For reference, total annual CapEx in the global telecom industry sits around $300B, and oil and gas around $1T. In 2010 the same Big 4 spent roughly $10B combined, so in 16 years the figure has grown about 70x.
 Source: Benedict Evans, “AI eats the world”, May 2026 (slide 8)
Two quotes compress the spending posture:
“The risk of underinvesting is dramatically greater than the risk of overinvesting.” — Sundar Pichai (Alphabet CEO)
“Worst case, we’ve just built a few years ahead.” — Mark Zuckerberg (Meta CEO)
The semiconductor cycle shows the same explosion. NVIDIA’s quarterly revenue in 2025 was about $67B, overtaking Intel (around $13B), and global monthly semiconductor billings crossed $100B for the first time in March 2026. Combined 2026 CapEx guidance for TSMC, Intel and Samsung sits around $150B, an all-time high.
The end of the asset-light model
Another implication is that Big Tech’s balance sheets have changed. Capex/Sales tells the story:
| Company | 2026 Capex/Sales |
|---|---|
| Meta | 55% |
| Microsoft | 54% |
| Alphabet | 44% |
| Amazon | 26% |
These were originally asset-light businesses that could fund CapEx out of free cash flow at around 10% of sales. By 2026 the ratio has climbed into the 50s. That level can no longer be financed purely from operating cash flow. The capital structure itself is shifting.
CNBC reported in October 2025 that “Meta partners with Blue Owl Capital on $27 billion AI data center project,” with the Hyperion data center (Louisiana) JV split 80/20 between Blue Owl and Meta. In December 2025 Bloomberg wrote “Oracle Debt Trades Like Junk as Bond, CDS Spreads Flare,” noting Oracle 5.2% 2035 note spreads widening by 1.71pp. The Financial Times has framed the $3T AI building boom as the moment private capital joins in earnest. Big Tech is now using debt, SPVs and OPM (Other People’s Money) to externalise capital — structured-finance territory.
OpenAI is trying to step into that capital club as well. The company has discussed 30GW+ build = $1.4T, an estimated $600B through 2030, and 1GW per week × $20B/GW = $1T/yr. Evans collapses it to one line:
“Other People’s Balance Sheets, circular revenue and a lot of plate-spinning.”
Price, usage and CapEx are far from balanced
Whether all this capital is close to equilibrium is the closing question of chapter 1. Slide 20 answers with the product of four variables:
| Variable | Direction |
|---|---|
| Demand growth | Explosive up |
| Inference efficiency | 50~100x per year down |
| Model variety (Edge / Open source / Asset life) | Undetermined |
| New frontier model every 6~9 months | Undetermined |
Demand is exploding and unit cost is collapsing, while the two variables that decide where pricing power lands — model variety and the cadence of next-gen models — are still undetermined.
What mobile infrastructure already taught us
The real closing question is “whose value does this $700B turn into?” Two charts on slide 24 give the answer.
 Source: Benedict Evans, “AI eats the world”, May 2026 (slide 24)
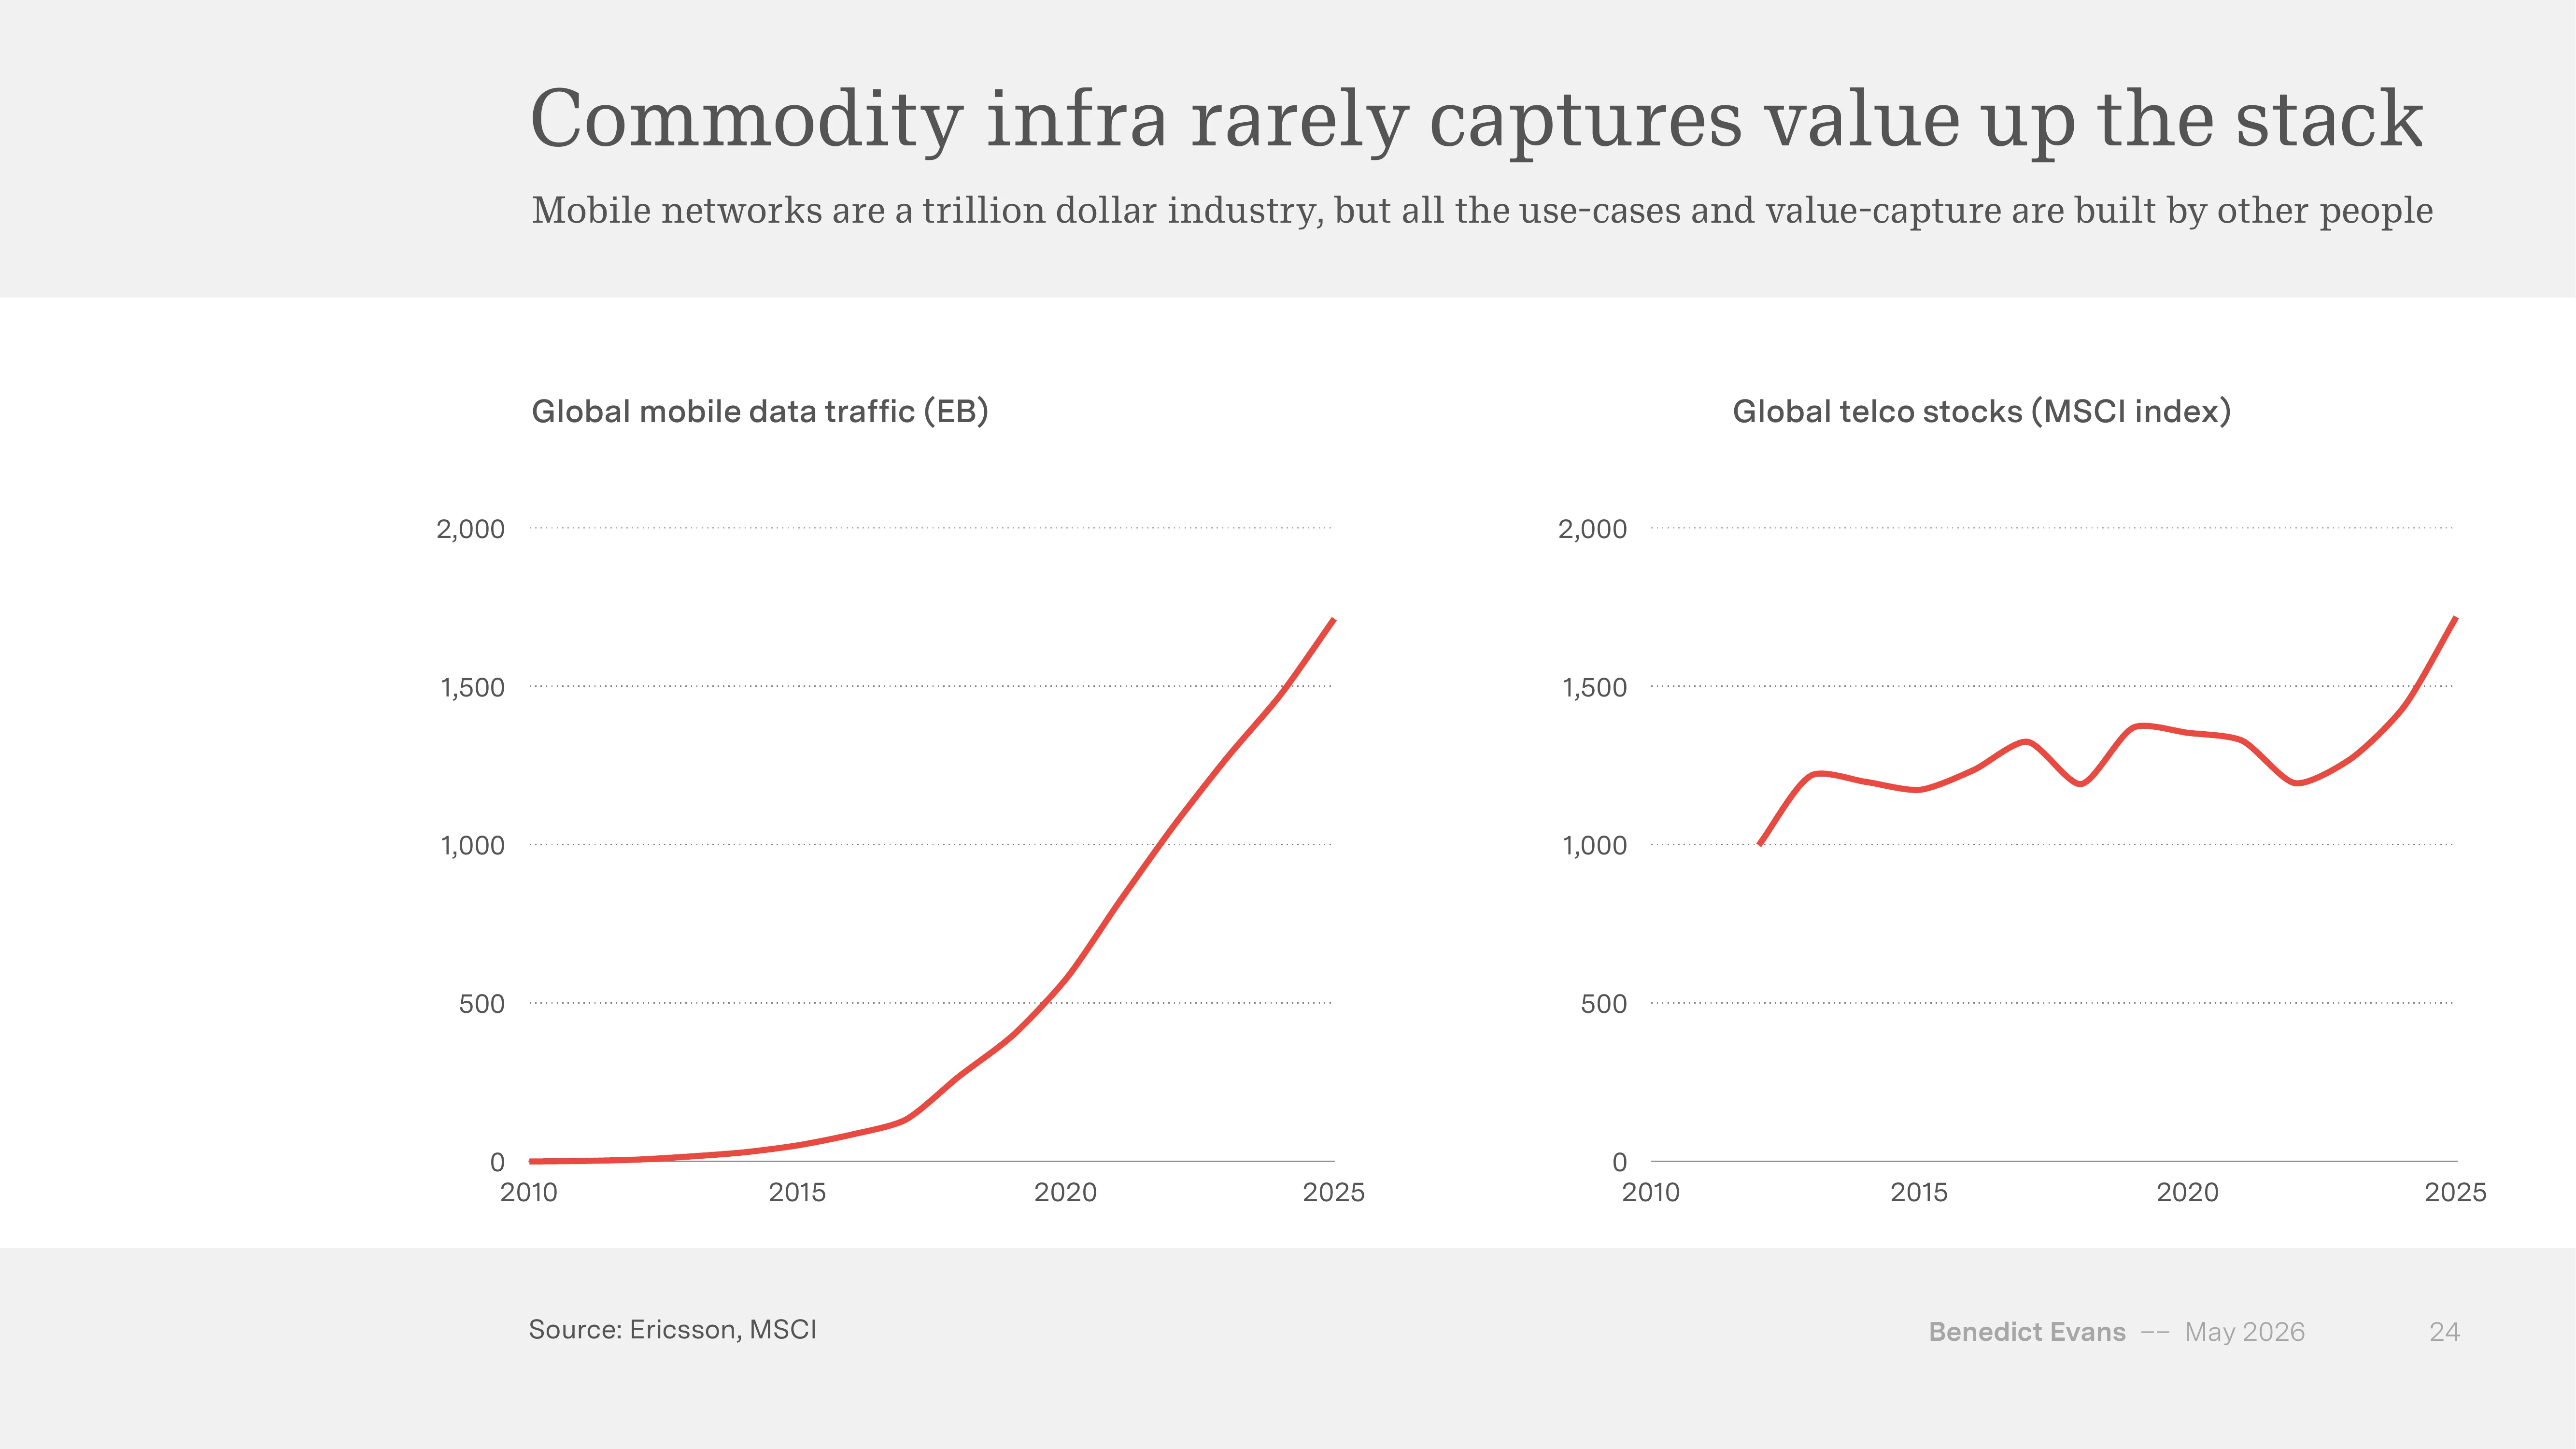
Between 2010 and 2025 global mobile data traffic grew from 17EB to 1,700EB, roughly 100x (Ericsson). Over the same period the global telecom MSCI index was essentially flat. Mobile networks became a trillion-dollar industry, but the value flowed to Apple, Google, Meta, Netflix and others who built on top.
The LLM market is starting to show a similar pattern. Frontier LLM benchmark scores from OpenAI, Anthropic, Google, Meta and Chinese labs have been converging on nearly the same curve since 2024 (slide 25). No network effects, commoditisation underway. Evans’ provisional conclusion:
Chat is a terrible UX. Labs can’t build (or generate) all the apps. Models are commodities and have no network effects. Models will just be infra. Innovation will move up the stack.
One thing worth pinning down — the infrastructure boom doesn’t translate into value capture for model providers
There’s a reason Evans pulls in the mobile-infrastructure comparison on slide 24. Between 2010 and 2015 the market assumed telecom carriers would be the direct beneficiaries of “100x data traffic.” The outcome went the other way. The value didn’t flow to whoever built the infrastructure; it flowed to whoever built new categories on top. App Store fees, advertising ARPU, subscription cashflow — all happened upstairs.
Asking the same question of today’s LLM providers makes the picture awkward. OpenAI and Anthropic carry $850B and $900B in private valuations, while at the same time frontier benchmark convergence, chat UX limits, and 50~100x token price drops are facts that don’t sit easily inside those price tags. NVIDIA’s $67B per quarter and Big Tech Capex/Sales in the 50s are the same numbers that one side reads as “this time really is different” and the other side reads as “so the next stage is margin compression.” Which reading is right turns into a function of how deeply this is actually used and how jobs change — questions that chapters 2 and 3 take up.
2. DEPLOYMENT — Wide adoption, shallow use
Chapter 2 changes tone. Capital is exploding, but if you look at how deeply that capital has actually deployed into the market, the picture is much shallower. Evans calls this “Mile wide, inch deep.”
900M WAU, but shallow depth
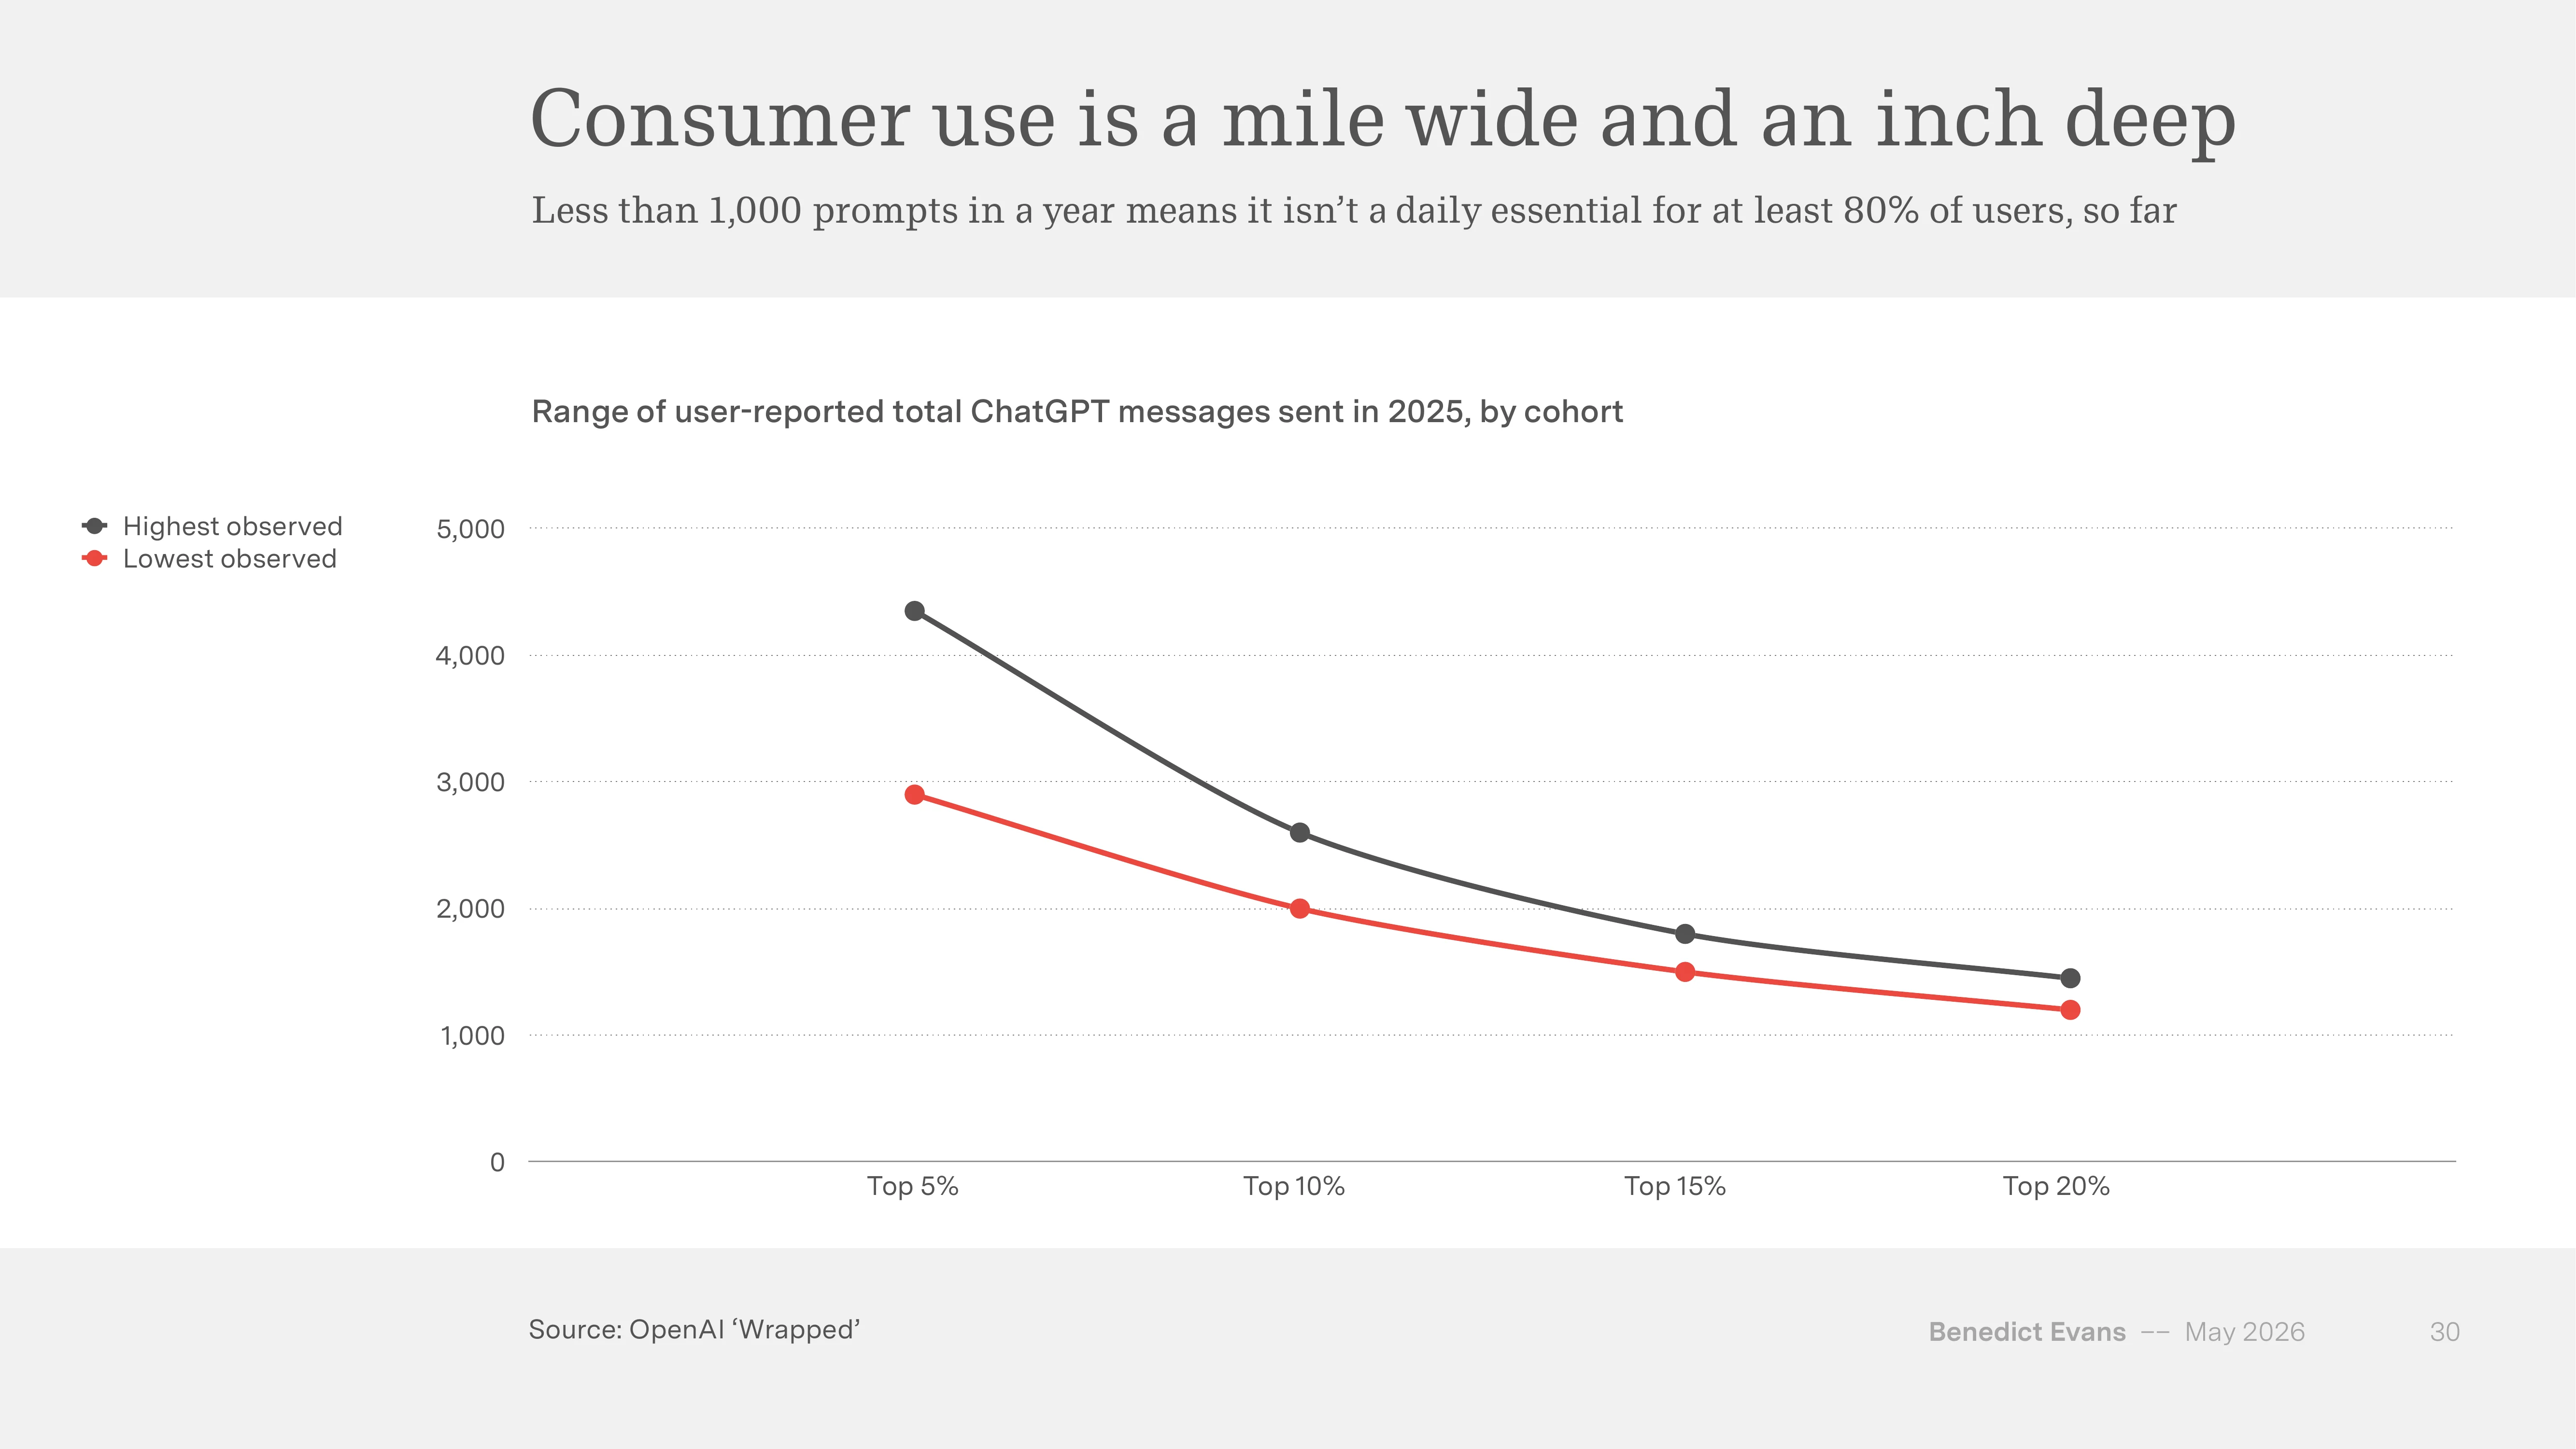
By consumer numbers ChatGPT is dominant. Global weekly active users (WAU, Weekly Active Users) at 900M+ would be hard to match by adding up Netflix, Disney+ and Spotify. Paid conversion is below 5%. More interesting is the usage depth implied by OpenAI’s ‘Wrapped’ data.
 Source: Benedict Evans, “AI eats the world”, May 2026 (slide 30, OpenAI Wrapped data)
| Cohort | 2025 annual messages (upper bound) |
|---|---|
| Top 5% | ~4,300 |
| Top 10% | ~2,600 |
| Top 15% | ~1,800 |
| Top 20% | ~1,450 |
Even the heavy top 20% sits below 1,450 messages a year, fewer than 4 a day. Evans summarises: “For at least 80% of users, ChatGPT isn’t a daily essential.”
Separate surveys on daily usage point in the same direction. Among US adults, 13% daily and 48% weekly (Bick et al, 2025.11). Even the most active cohort, 13~17 year-olds, is only at 26% daily (Pew). There is a wide gap between “everyone has tried it” and “everyone uses it daily.”
At work — sharp variance by industry
The workplace picture is even more uneven. Gallup’s December 2025 US workplace AI use data:
| Industry | Any | Weekly | Daily |
|---|---|---|---|
| Tech | ~75% | ~55% | ~30% |
| Finance | ~63% | ~38% | ~18% |
| Professional services | ~62% | ~37% | ~17% |
| Healthcare | ~40% | ~13% | ~8% |
| Retail | ~32% | ~13% | ~7% |
| Manufacturing | ~40% | ~21% | ~10% |
| Government | ~42% | ~22% | ~7% |
Tech is up to 30% daily, while Healthcare, Retail and Government sit around 7~8% daily.
Enterprise adoption tells the same story. Bain’s Q3 2025 survey of Production rates by use case shows coding alone in the 40s, with everything else under 30%.
| Use case | Production | Pilot+ |
|---|---|---|
| Software | 40% | 73% |
| Customer Service | 32% | 72% |
| Marketing | 26% | 65% |
| Knowledge Management | 25% | 66% |
| Operations | 24% | 61% |
| IT | 28% | 63% |
| Sales | 22% | 62% |
| Finance | 9% | 43% |
| HR | 9% | 38% |
| Legal | 3% | 38% |
Evans labels this “Everyone has a pilot.” Many try, but the use cases that reach Production cluster in one area.
Why only coding has clear PMF
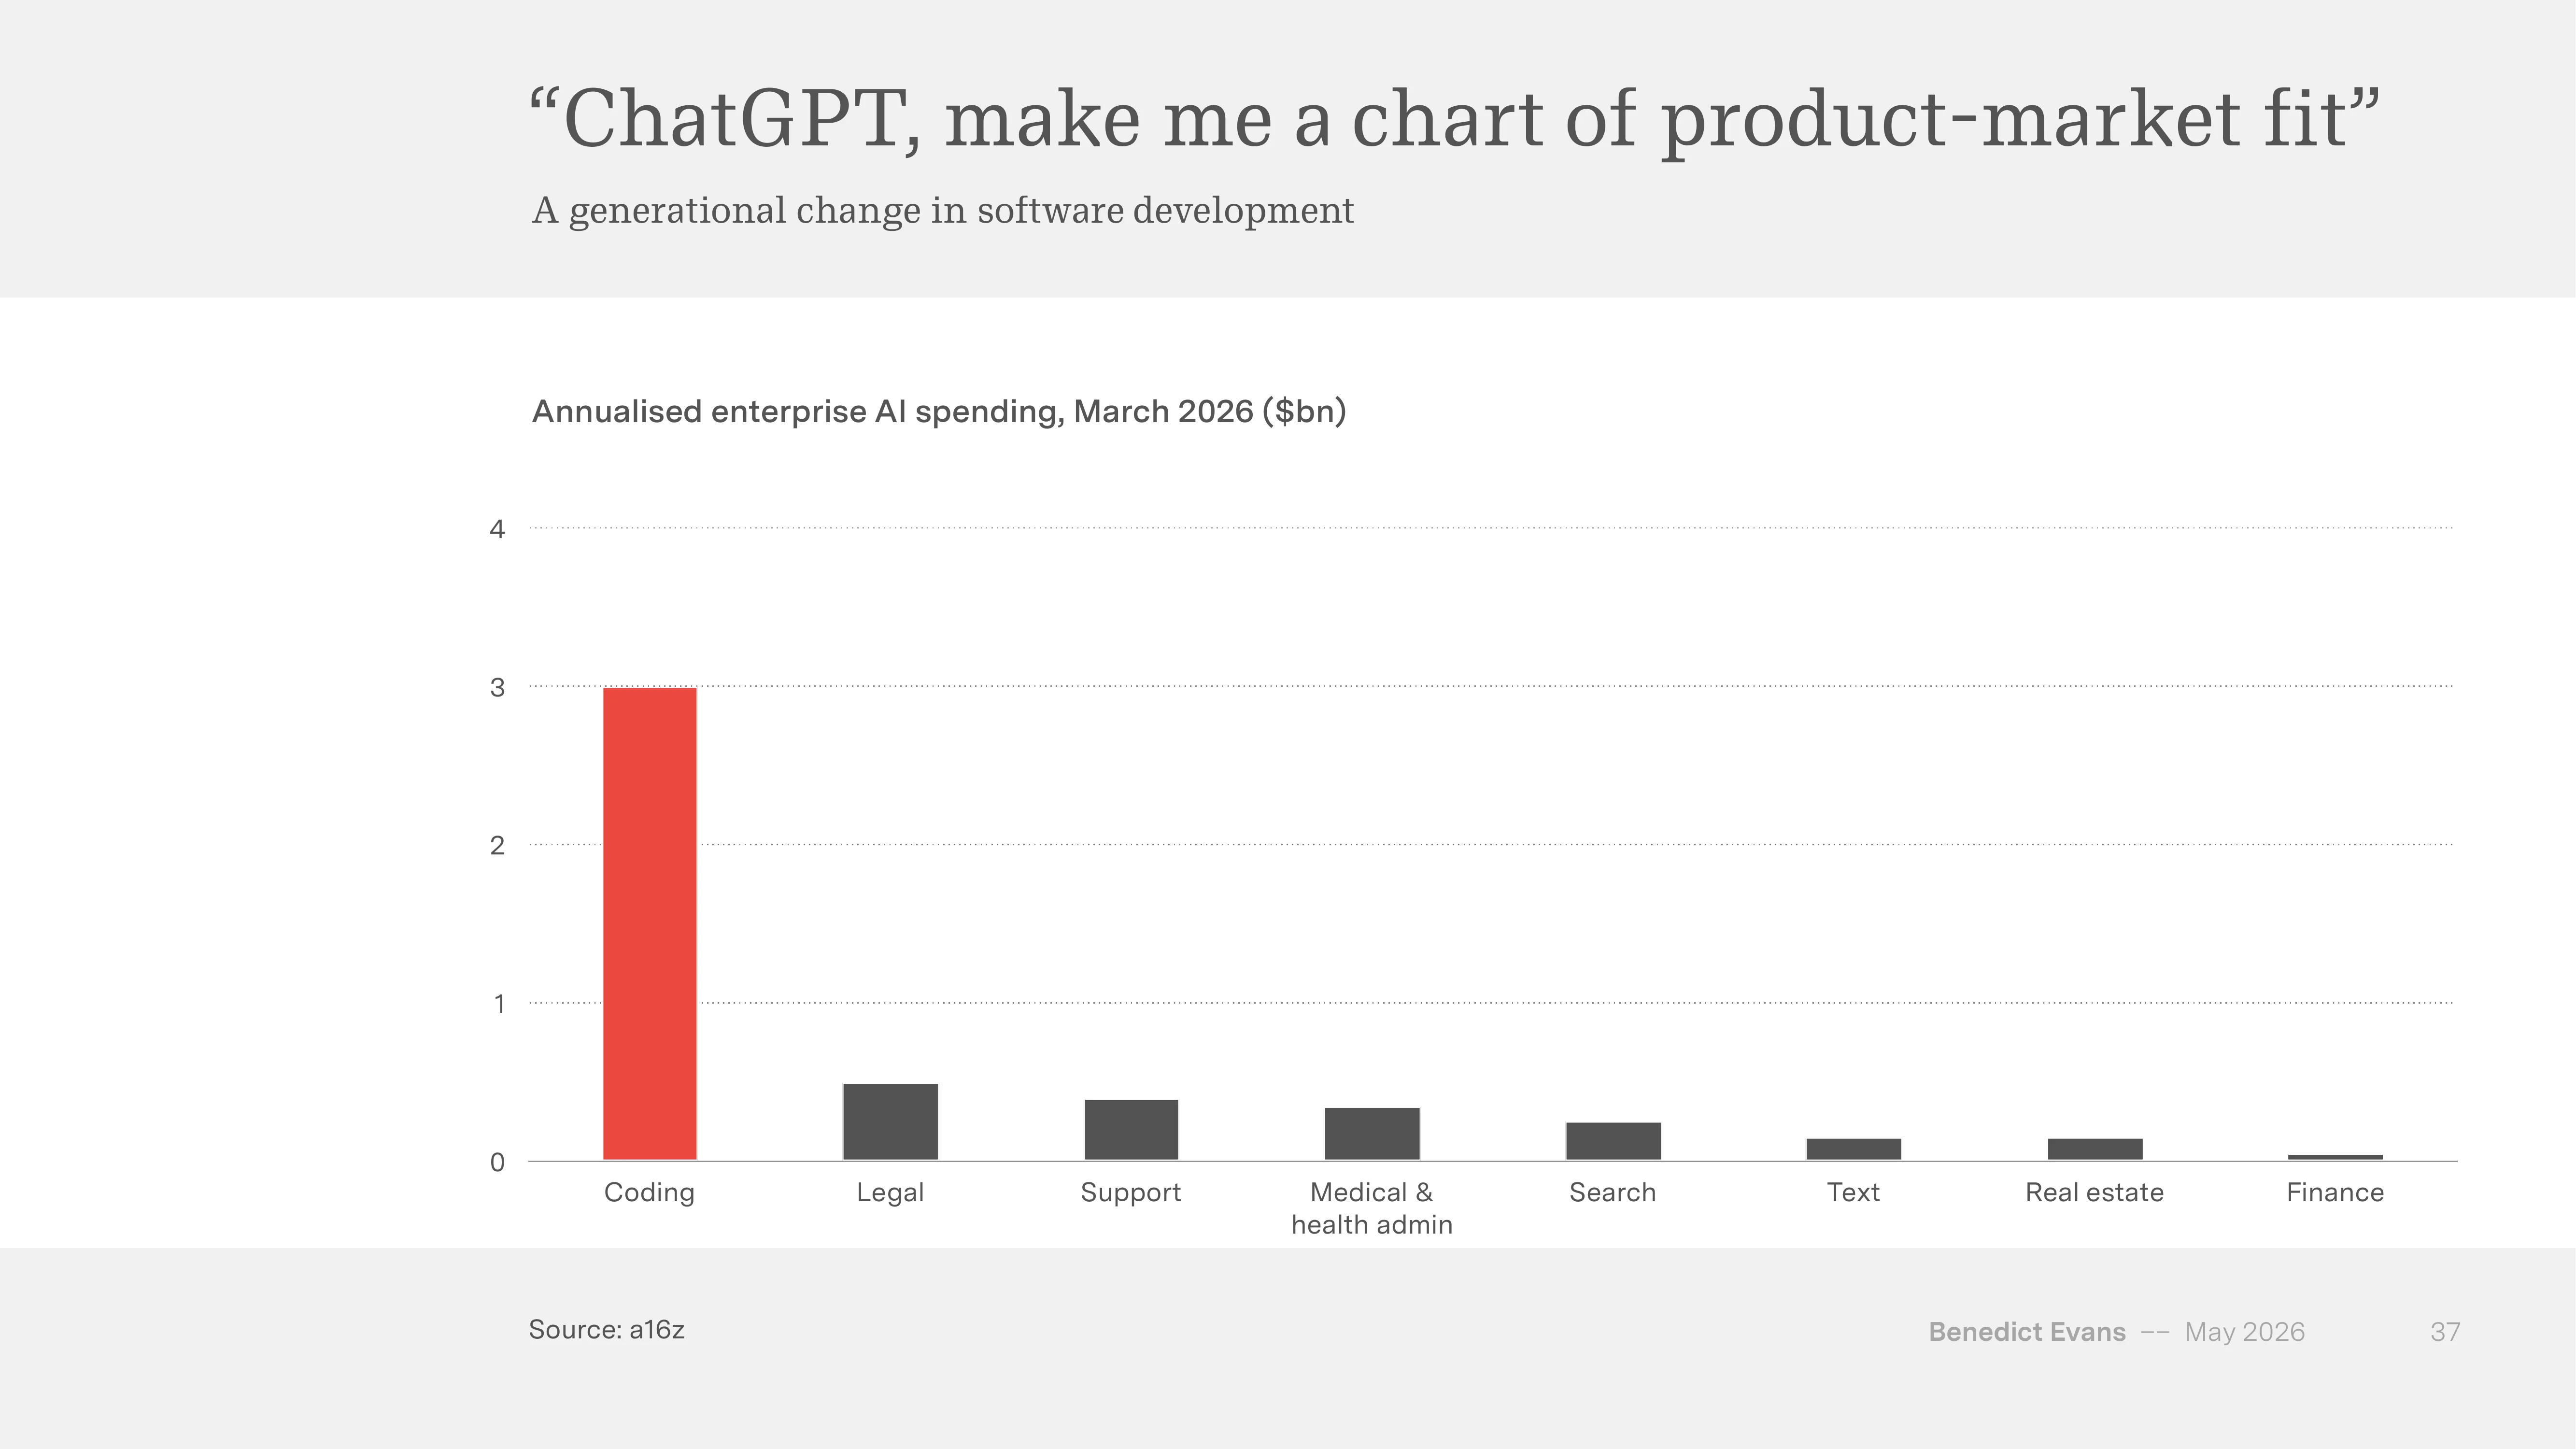
The a16z data goes further. Annualised enterprise AI spend as of March 2026 is dominated by coding. The gap between the area that found PMF (Product-Market Fit) and everything else is large.
 Source: Benedict Evans, “AI eats the world”, May 2026 (slide 37)
| Domain | Annualised spend |
|---|---|
| Coding | ~$3.0B |
| Legal | ~$0.5B |
| Support | ~$0.4B |
| Medical & health admin | ~$0.35B |
| Search | ~$0.25B |
| Text | ~$0.15B |
| Real estate | ~$0.15B |
| Finance | ~$0.05B |
Coding alone is roughly 1.5x the sum of the other seven domains. Uber CTO Praveen Neppalli Naga’s comment on the situation:
“The budget I thought I’d need has already burned, so I have to redraw it from scratch.” — Praveen Neppalli Naga (Uber CTO)
He says Claude Code use burned through their 2026 annual AI budget in months. Zuckerberg cites a similar phenomenon from another angle:
“One or two people can do in a week what used to take dozens of people months.”
Automation as a manual-labour industry
It’s also worth noting that automation itself is becoming a manual-labour industry. Accenture’s quarterly generative-AI new bookings rose from zero in Q1 2023 to $2.2B in Q4 2025. OpenAI signed multi-year Frontier Alliances with BCG, McKinsey, Accenture and Capgemini, and in May 2026 announced a $10B JV with private-equity firms. Anthropic launched a $1.5B JV with Blackstone and Goldman Sachs. AI adoption is entering an era of systems-integration (SI), consulting and financial roll-ups.
One thing worth pinning down — Production yields good demos, not good businesses
Coding’s $3.0B is striking. But the number can also be read another way. First, the area that reached Production and the business depth of that area are two different axes. Coding automation reached Production fastest, but the end state is one person writing what used to take dozens, in a week. That means the cost base of the market for buying and selling code (outsourcing, SI) is being eroded fast, and what new categories may grow upstairs is a separate question.
Second, “Everyone has a pilot” is not the same as production-ready. If you remove Software from Bain’s data, every use case is under 30% in Production. 900M WAU with sub-5% conversion, top-20% heavy users at fewer than 4 messages a day, and daily workplace use stuck at single digits in many industries — they all point the same way from different angles. Adoption being wide doesn’t mean it gets deeper; wide adoption and depth distribute separately.
Combined with chapter 1, the picture gets more awkward. $700B CapEx, 900M WAU, and 7~30% daily by industry don’t sit on the same curve.
3. CHANGE — Job or Task?
Chapter 3 is the most interesting. The starting point is that the definition of what’s automatable has itself shifted.
Redefining what’s automatable
| Old automation | New automation |
|---|---|
| What you can describe in logical steps | What you have enough training data for |
| Deterministic systems | + Probabilistic systems (if checkable) |
Evans’ phrasing: “Adding probabilistic systems on top of deterministic systems as a new general purpose technology.” The set of automatable activities has more than doubled. That doesn’t translate directly into job loss — and that’s the other side of the same chapter.
Two historical patterns — elevator operators vs accountants
Two professions saw the same kind of automation produce opposite outcomes.
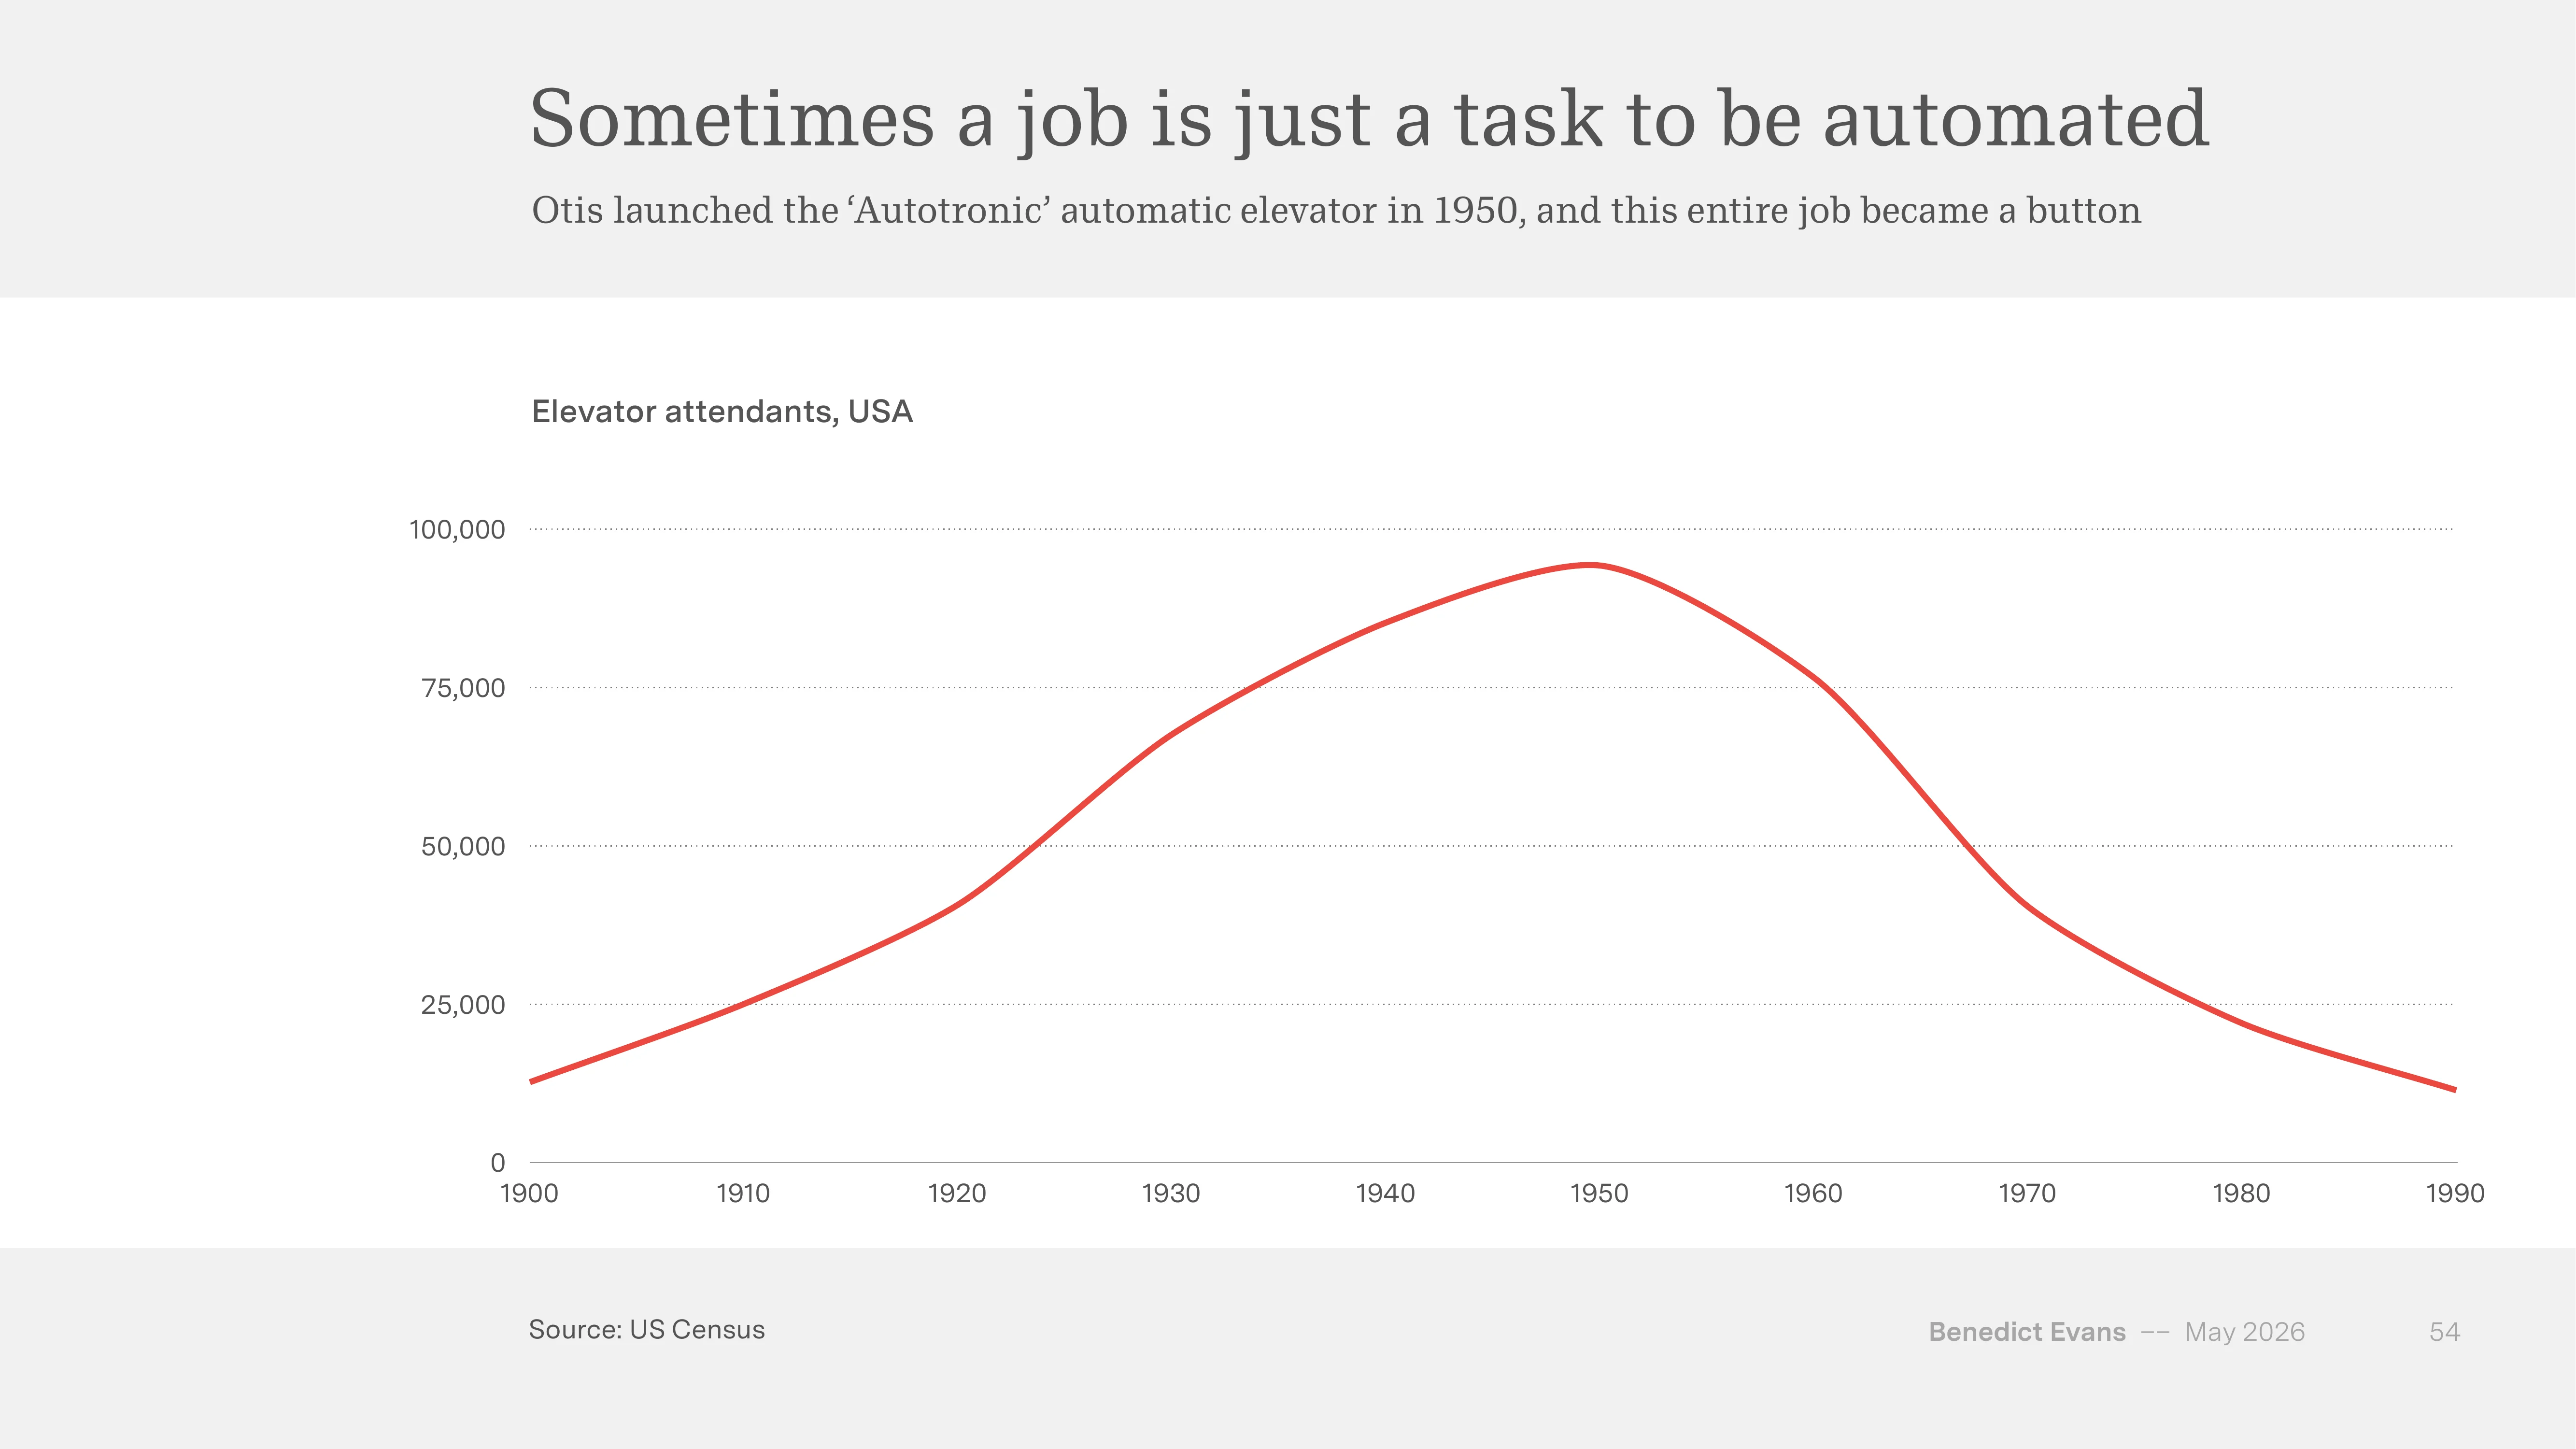
Elevator operators (Pattern A): US Census data shows the count rising from 12,000 in 1900 to 95,000 in 1950 — and then collapsing to nearly zero by 1990 after Otis launched the Autotronic automatic elevator in 1950.
 Source: Benedict Evans, “AI eats the world”, May 2026 (slide 54, US Census)
The work disappeared because “the task was the whole job.” Evans puts it as: “This entire job became one button.”
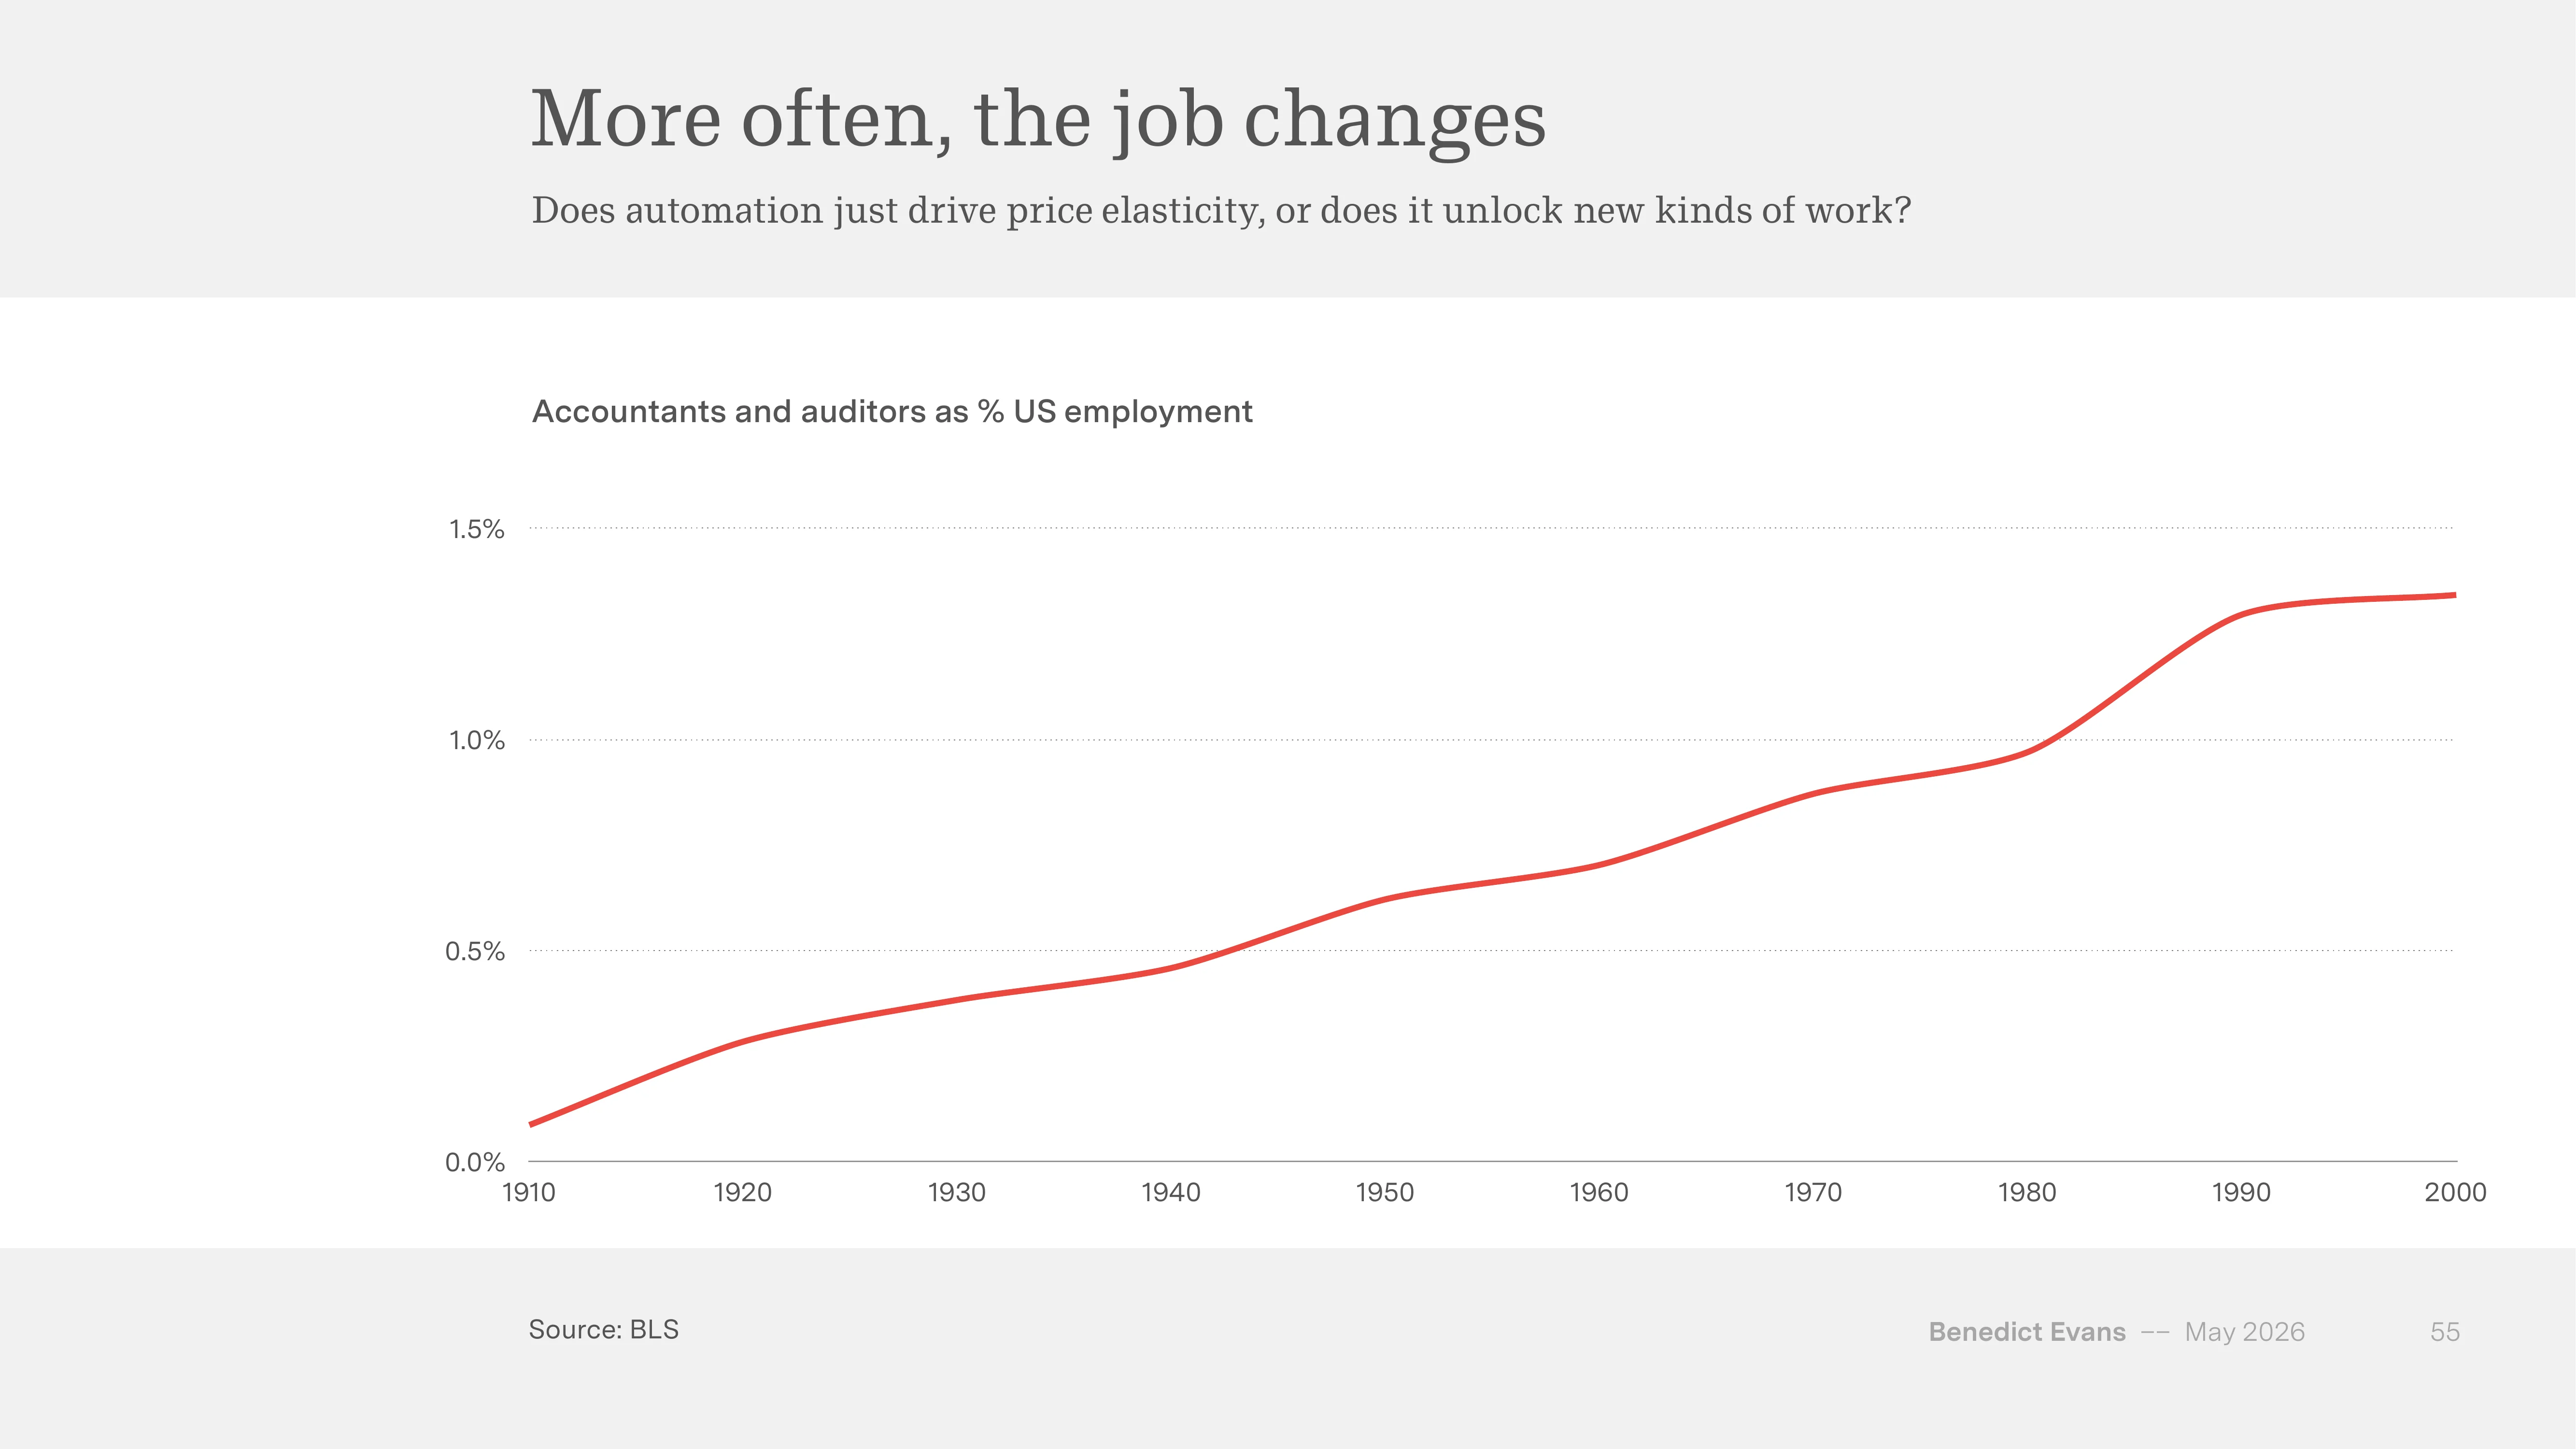
Accountants (Pattern B): Their share of total US employment rose from near 0% in 1910 to 1.4% by 2000. Even during the years when accounting automation tools spread most rapidly (1970~2000), the share kept climbing.
 Source: Benedict Evans, “AI eats the world”, May 2026 (slide 55, BLS)
CPA hiring also grew from 10,000 in 1970 to 43,000 by 2014. Automation tools lifted the task load, and the new analytic and advisory work that became possible on top of that load expanded the profession.
%%{init: {'theme':'neutral', 'look':'handDrawn'}}%%
graph TD
    Q["What is being automated?"]
    Q --> T["Task IS the whole job"]
    Q --> J["Task is part of the job; real value lies elsewhere"]
    T --> A["Elevator operators<br/>1990 ≈ 0"]
    J --> B["Accountants<br/>2000 = 1.4% of US jobs"]
    A --> A2["Jobs disappear"]
    B --> B2["Jobs expand"]

    style A fill:#fee2e2
    style B fill:#dcfce7
Same technology, different outcomes. The difference lies in whether the work was a task or a job.
Infinite interns — when price goes to zero
Evans makes another point: when price approaches zero, work that wasn’t possible before opens up. After barcode adoption in 1974 the average US supermarket SKU count went from 10,000 to 51,000 by its 2008 peak, a 5x rise. Inventory management became free, and the catalogue size that became feasible grew with it.
Something similar is starting to happen with AI. Evans’ phrasing: “AI gives you infinite interns.”
| Old question | New question |
|---|---|
| Listen to all calls and tell me about weird customers | Listen to 1M calls a day and tell me what you see |
| Where can I buy this coat | Look at my Instagram and buy me a winter coat that freshens up my look |
When price drops, the question itself shifts. Not “all calls” but “1M calls a day.” Not “this coat” but “the full context of my Instagram.” Not just automation — the price drop enables questions that couldn’t be asked before.
Task vs Job — the harder question
Following this frame leads to the table on slides 67~68.
| Task (easy part) | Job (hard part) |
|---|---|
| Pull SKUs, write code, build XLS, draft specs | Tacit knowledge, perspective, taste, new ideas |
| Average values, what the crowd would say | What’s new and different, what most would think is stupid |
The music industry had a similar structure. The physical cost base of the CD disappeared, so the labels’ moat went too. But the “music” job didn’t disappear; it re-formed around streaming. Global music revenue went from $39B in 2000 to a $17B trough in 2014 before recovering to $32B by 2025.
The question collapses to one line. “How do you separate the music from the plastic?” Was the cost base of what I was selling a task or a job?
One thing worth pinning down — the job-side outcome doesn’t arrive on its own
A trap in the task-vs-job framework is reading the accountant case too optimistically. Accountants didn’t grow as a share of employment from 1970 to 2000 because automation magically created new jobs. They grew because the professional infrastructure that defined the job — CPA licensing, audit regulation, separation of tax and legal work — sat above the tasks. When automation tools arrived, that infrastructure was a container that absorbed new advisory and analytical work.
The music industry is the same. CDs died and streaming survived because copyright, licensing, and artist-contract infrastructure simply shifted form and landed on streaming. Without that infrastructure, “music” alone wouldn’t have recovered.
So in AI as well, task automation doesn’t naturally grow jobs above it. For jobs to grow, the infrastructure defining the profession has to already sit above the tasks, or be built quickly. Licenses, regulations, trust mechanisms. Without that, you’re on the elevator-operator path.
That’s the real takeaway of chapter 3. Whether automation creates or destroys jobs depends not on how much of the work is task, but on whether the infrastructure above the task exists.
4. Welcome to the Beginning — Evans’ conclusion
The closing chapter takes a step back. Lots of data was shown, but Evans is open that he doesn’t know the answer either.
Is this time different?
By raw capital-market scale, yes.
| Item | Market value |
|---|---|
| Total IPO market cap, US 1995~2000 ventures | ~$775B |
| OpenAI private market valuation | ~$850B |
| Anthropic private market valuation | ~$900B |
The private valuations of OpenAI and Anthropic each exceed the full IPO market cap of the entire 1995~2000 dot-com US venture cohort. And yet, back in the 1950s, IBM was already running ads for “150 EXTRA Engineers” — an ad copy promising “the equivalent of 150 more engineers” at a time when the term artificial intelligence didn’t yet exist. The “this time really is different” cry has come back at every platform shift.
Two answers to every AI question
Evans says every AI question has only two answers.
“Nobody knows.” — William Goldman, on the film industry
“What happened the last time everything changed.” — history
Slot your own question in between, he says.
Same shock, different outcomes
One more piece of decisive data shows up near the end. The same shock can produce different industry outcomes.
 Source: Benedict Evans, “AI eats the world”, May 2026 (slide 75, TLC, Airbnb, Morgan Stanley)
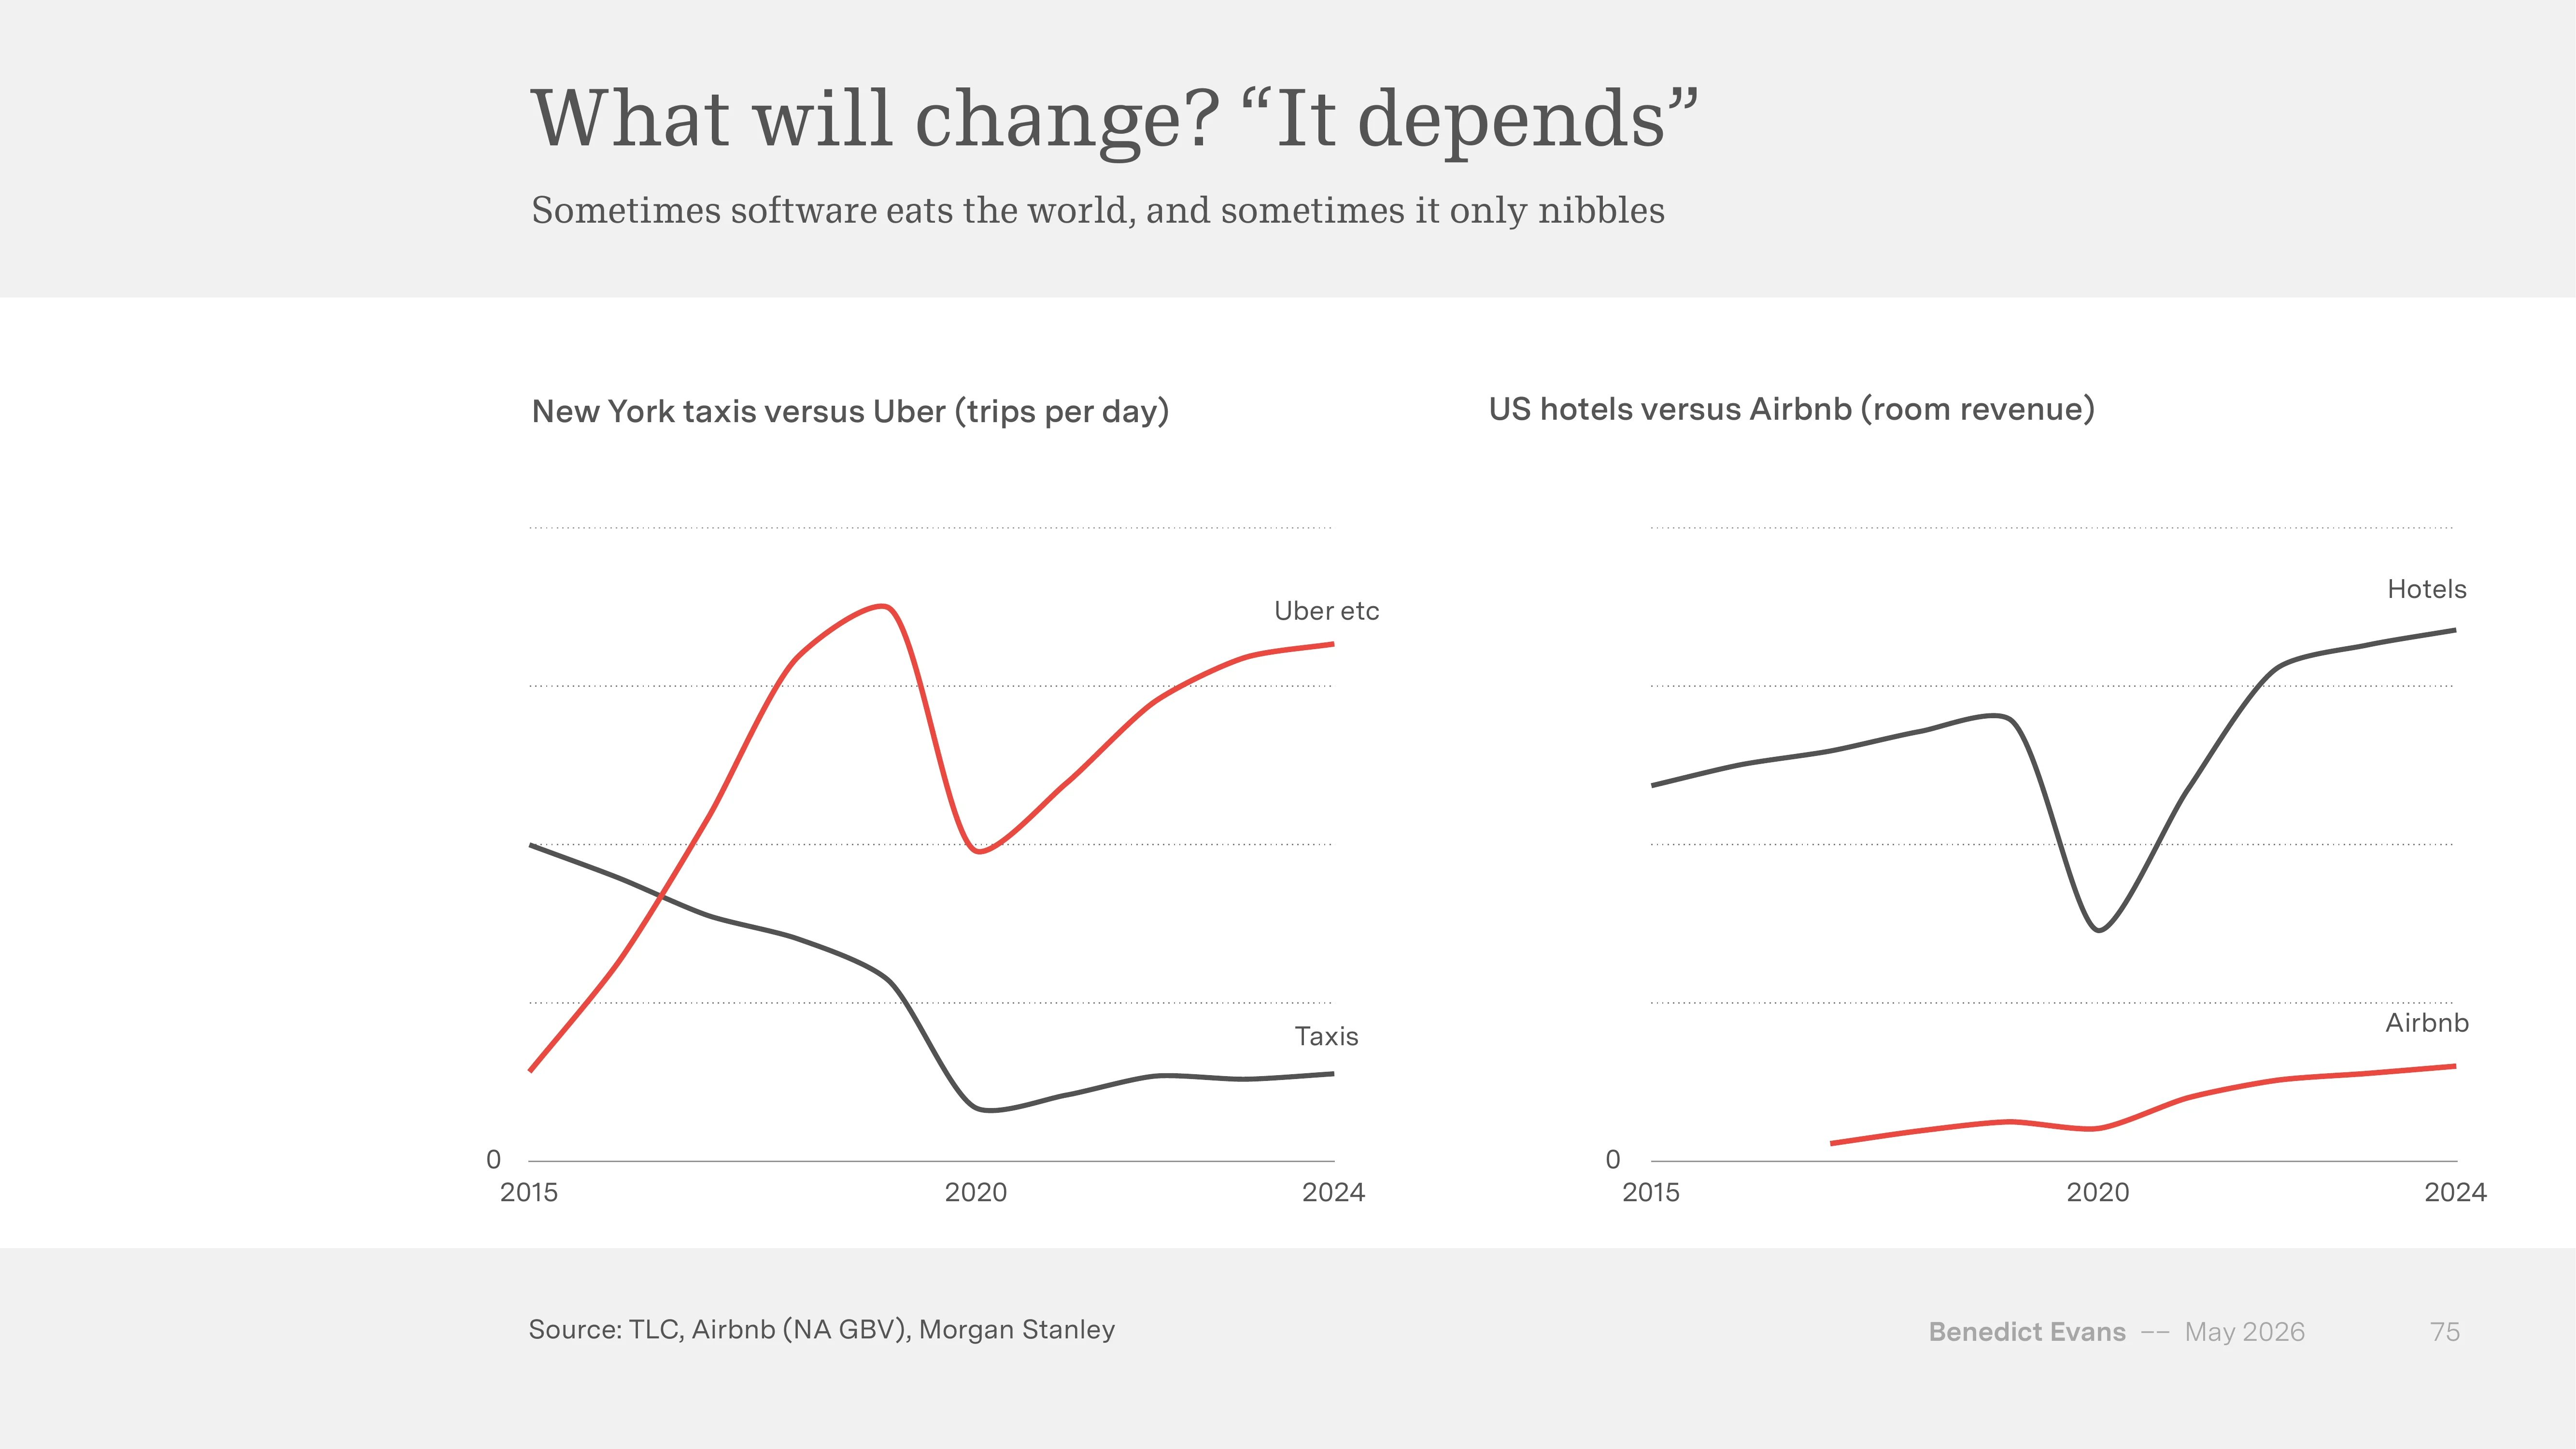
After Uber arrived, NY taxi trips per day fell sharply between 2015 and 2020, with almost no recovery — close to a full overturn. US hotels, on the other hand, grew alongside Airbnb, dipped briefly in 2020, and hit new highs by 2024. Two markets, one “smartphone + sharing economy” shock, two different outcomes.
Evans’ three closing questions
The deck ends with three questions:
- What can my competitors and I do with this?
- Can it unlock — or break — something decisive in my business model?
- Have I prepared scenarios on the assumption of fundamental uncertainty?
Anyone who claims to know the answer in advance, Evans suggests, is someone who has never seen the IBM “150 EXTRA Engineers” ad.
Closing — what the 79 slides collapse into
The numbers are all new. $700B CapEx, 900M WAU, coding’s dominance in enterprise PMF, a new frontier model every 6~9 months. New numbers don’t predetermine the outcome. The biggest lesson is the mobile chart — 100x in traffic, flat in telecom equity.
Stacking the 79 slides together, the same question shows up three times. Chapter 1 separates infrastructure boom from value capture , chapter 2 separates wide adoption from deep usage , chapter 3 separates task automation from the direction of job change. The three chapters point at the same separation, at three different levels.
The harder part is that this separation always comes down to “is there infrastructure above the layer in question?”. The mobile winners had the App Store, advertising ARPU, and subscription cashflow infrastructure above the network. Accountants survived because CPA, audit and tax infrastructure sat above the task layer. The same applies to AI. We can see task automation arrive in 6~9 months; what grows on top of it depends on whether the infrastructure design is there.
That may be why Evans bothered to quote William Goldman at the end. “Nobody knows.” But we do know what happened last time. This time as well, the speed of task automation isn’t what splits the outcome — the design of infrastructure above the task is.
Source: Benedict Evans, “AI eats the world”, May 2026 (79 slides, www.ben-evans.com). Cited data, per slide footers, draws from Apple, Google, Gartner, WSTS, US Census, OpenAI, Bain, Atlanta Fed, a16z, Y Combinator, ArtificialAnalysis, Accenture, AICPA, BLS, FMI, IFPI, NVCA, TLC, Airbnb, Morgan Stanley, Ericsson, and MSCI. Korean-language supplementary notes from the PyTorch KR forum (discuss.pytorch.kr/t/.../10290).
Related Posts

Re-reading the Stanford AI Index 2026 — Why It Feels Weaker Than Last Year
Reading the 2026 AI Index left a recurring impression — this year's edition lands softer than last year's. This piece chases that impression. Side by side: the report's headline indicators, and the shifts that landed outside it during the eight weeks before publication.
Deepfake Detection $15B — Who Are the Real Buyers?
The real buyers driving Deepfake Detection toward $15B aren't security teams — they're BFSI KYC departments. Four-SaaS breakdown, Hong Kong incident impact, and the Korean KYC 2.0 mapping through data.
The Identity Track — From Proof of Personhood to AI Agent Delegation
Proof of personhood and AI agent identity are two layers of the same track. World ID, Passkey, DID adoption curves + Defakto, t54, Indicio funding + payment network entries — the entire identity track in one piece.